View costs by service
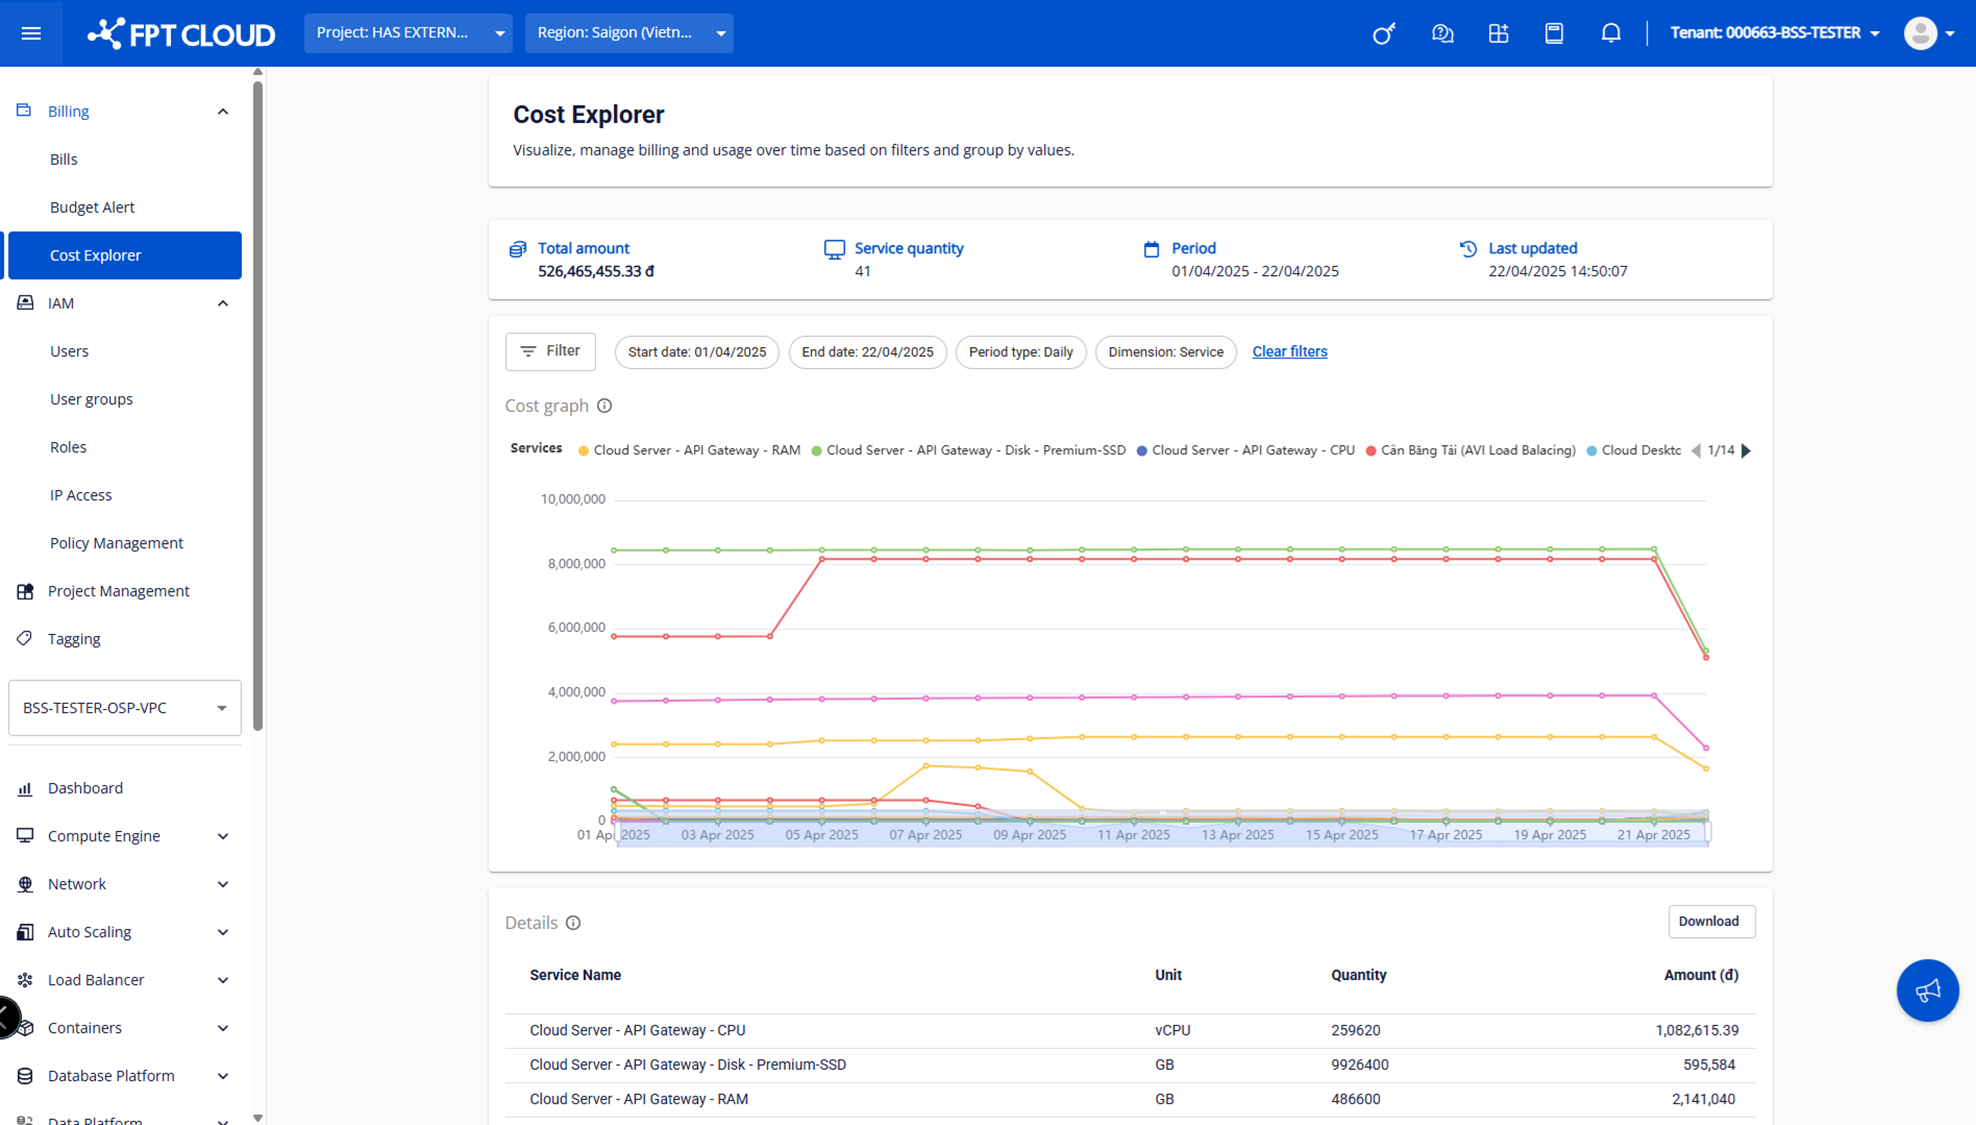
Cost Explorer lets you view a cost chart broken down by service, making it easy to identify which services consume the most budget.
View the cost dashboard
-
Select Billing → Cost Explorer. The system displays costs across all services used by all projects in the tenant.
-
Drag the scroll bar or scroll the mouse to zoom in or zoom out the chart and view data at each point in time.
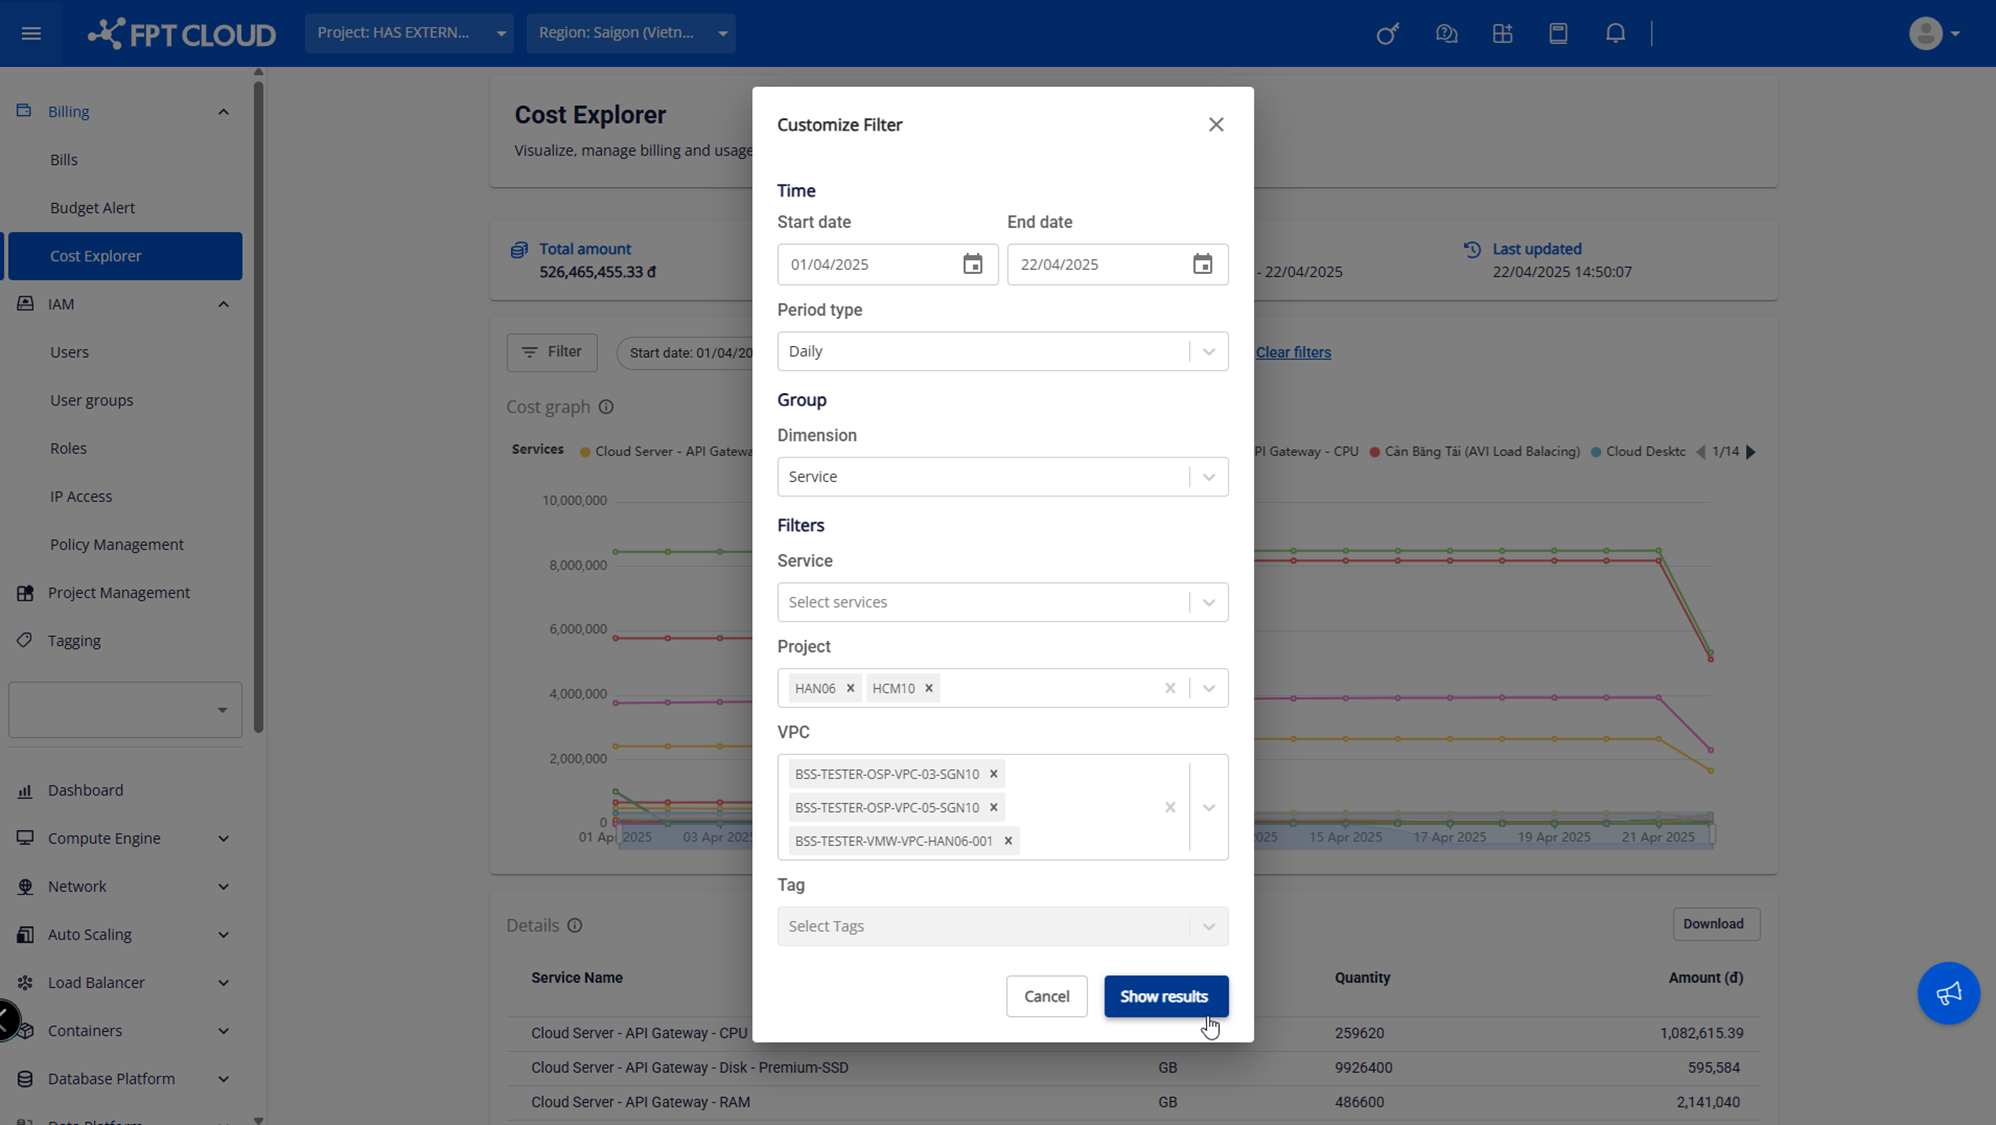
Customize filters (Customize Filter)
-
Click Customize Filter. A pop-up appears for selecting filter conditions.
-
Available filter conditions:
- Start date – End date: the billing period.
- Period type: view cost movement as daily (Daily) or monthly (Monthly).
- Service: service name. You can select multiple services. If no service is selected, data for all services is shown.
- Project: you can select multiple projects. If left blank, data is not filtered by project.
- VPC: you can select multiple VPCs. If a specific project is selected, only VPCs belonging to that project are shown.
- Tag: tags managed on the Portal. You can select multiple tags.