Integrate Load Balancer with FPT Monitoring (FMON)
This feature integrates the Load Balancer with the FPT Monitoring (FMON) service, enabling you to push access logs or metrics from a Load Balancer to a Monitoring workspace for easy visualisation and analysis through Grafana — especially useful for troubleshooting issues.
Prerequisites: Your VPC must have an existing FMON monitoring workspace with sufficient quota for the storage requirements.
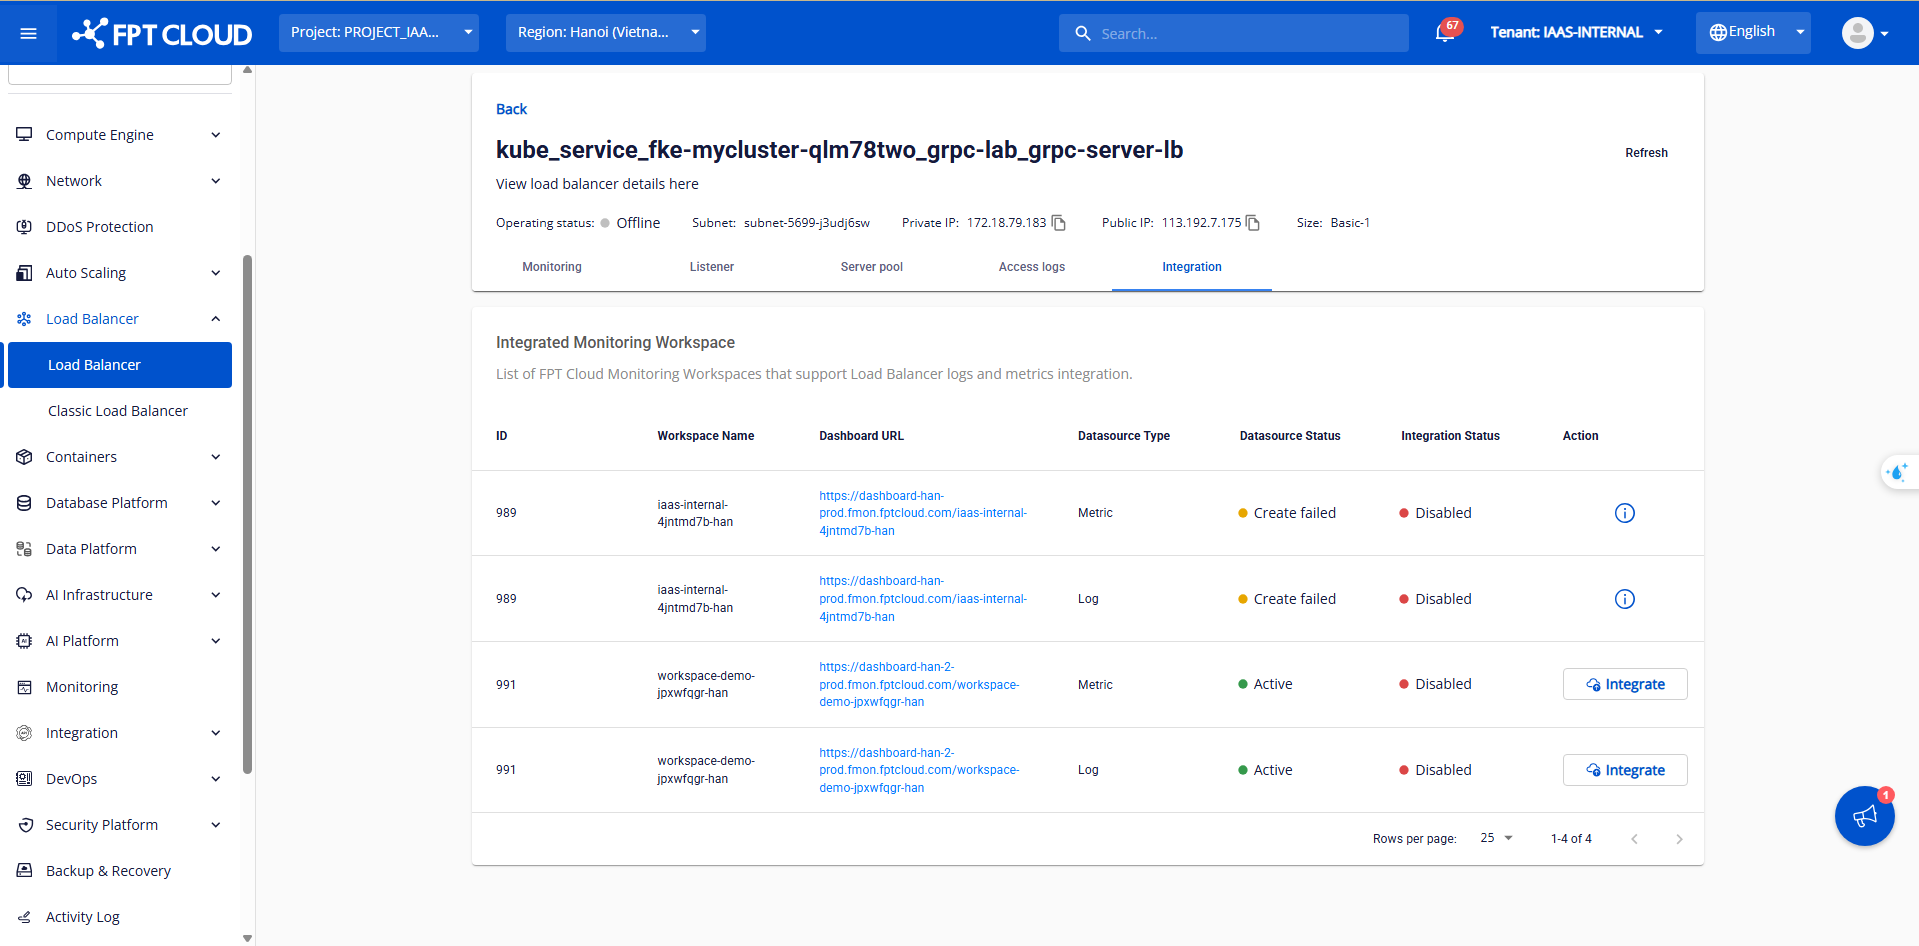
Step 1: Open the Load Balancer detail page for the Load Balancer you want to integrate, then click the Integration tab. A list of Monitoring workspaces available in the VPC is displayed.
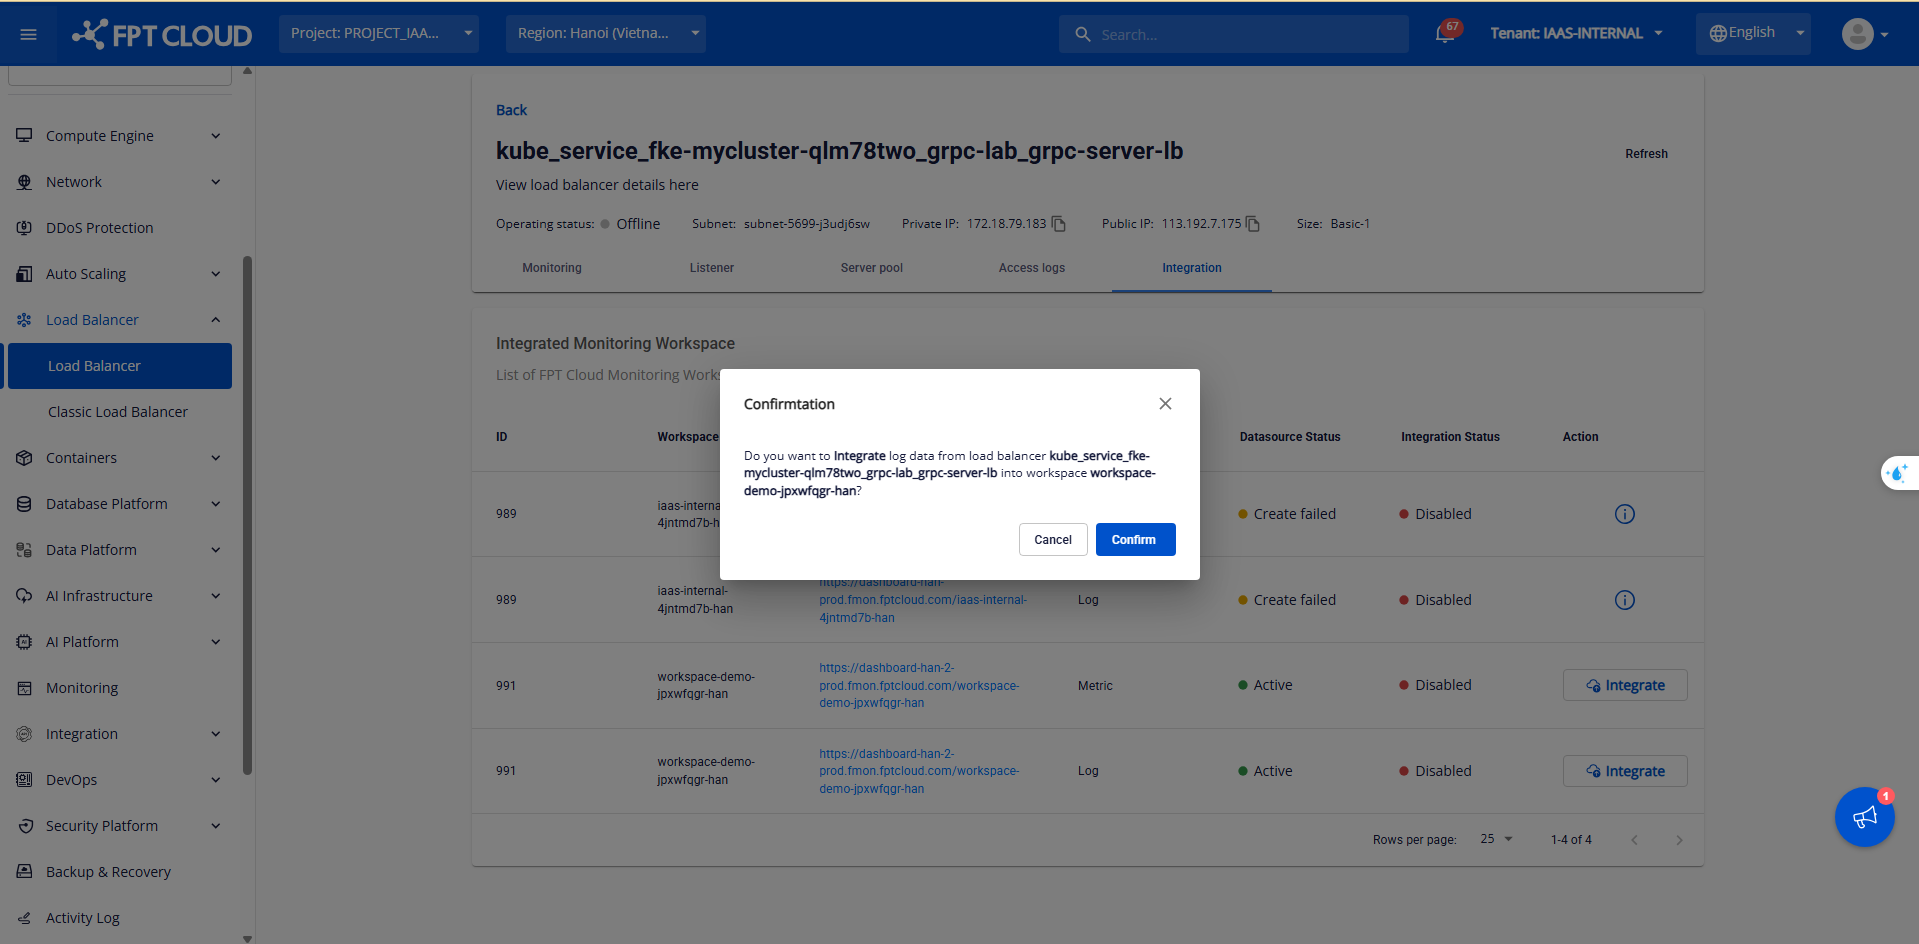
Step 2: Click Integrate to begin integration. A confirmation popup appears — click Confirm.
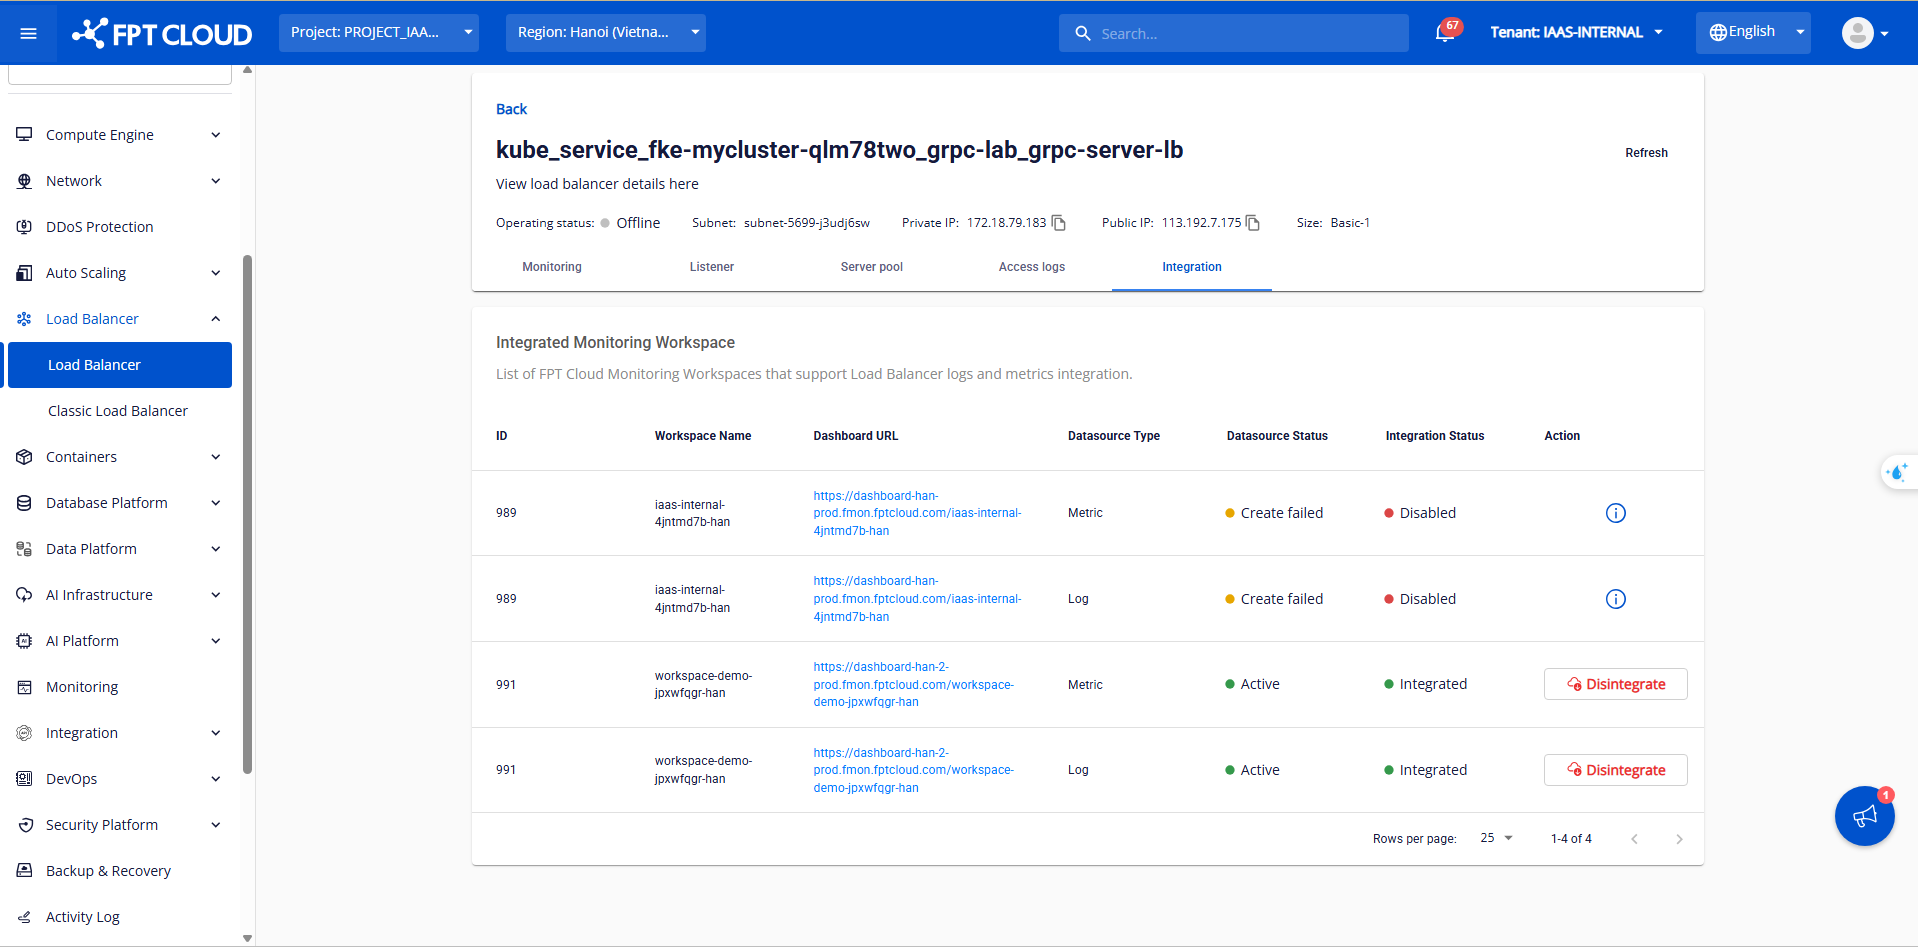
Step 3: After confirming, the status changes from Disable to Integrating. Wait 1–2 minutes for the integration to complete. The status will change to Enable.
Step 4: Click the Dashboard URL link. A Grafana login page appears.
4.1 Use the Username and Password from Basic Authentication to log in, then click Log In. The Grafana home page appears.
For Access logs:
4.2 Click the Toggle Menu next to Home, then select Explore > Loki.
4.3 In the Label filter, select Label > Load Balancer, then click Run Query. The Load Balancer logs appear.
For Metrics:
The system has pre-built a dashboard template for visualising Load Balancer metrics.
4.2 Select Home > Dashboard > LB_Dashboard.
4.3 Select the Load Balancer you want to view and click Run query to display the dashboard.