Dashboard metrics: Organization overview
The Organization overview section displays metrics for your organization (aggregated data from all teams).
Note: Charts use data from the most recent successful scan. Click Refresh to reload data.
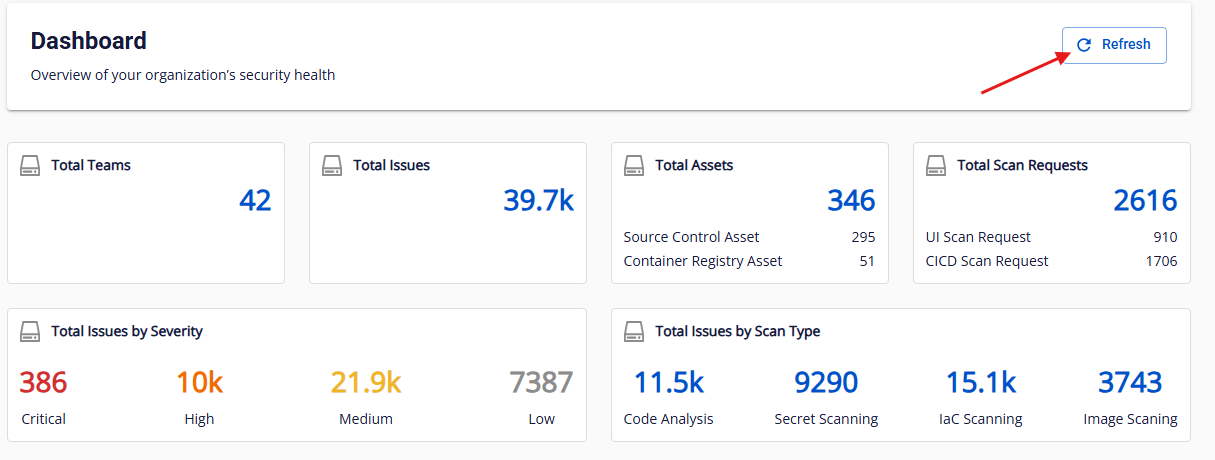
If there is no data, a dash ("-") is displayed by default.
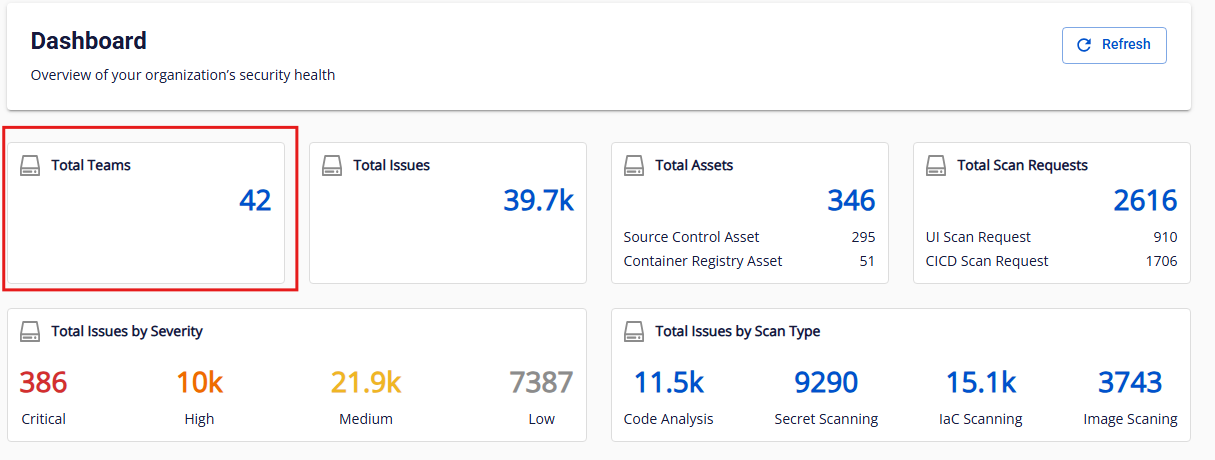
Total teams
Description: Total number of teams in the current organization.
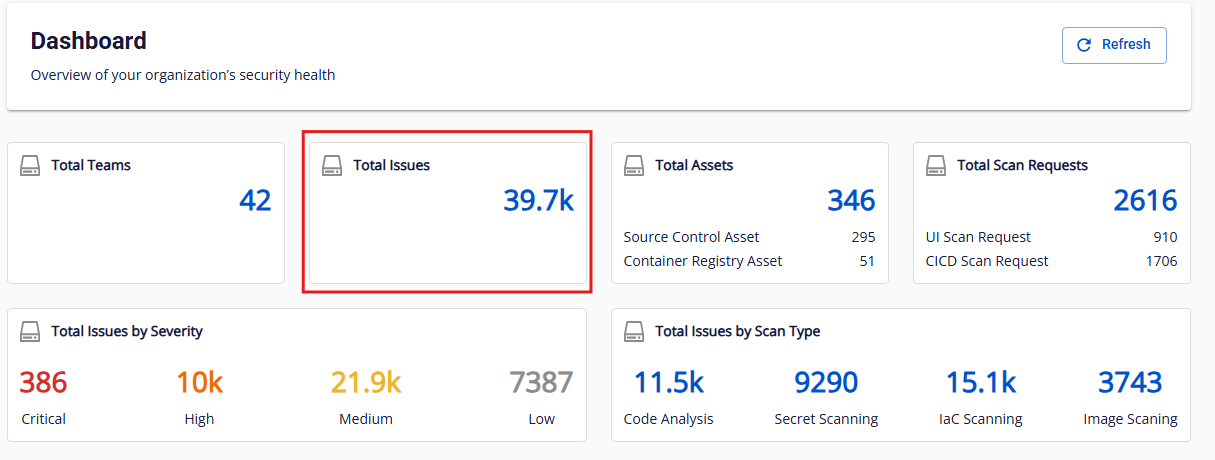
Total issues
Description: Total number of issues recorded in the most recent successful scan across all assets in the organization (including teams and sub-teams).
Display format:
- 0 – 9,999: shown in full (e.g., 5, 1200)
- 10,000 – 999,999: abbreviated in thousands (k), one decimal place, rounded down
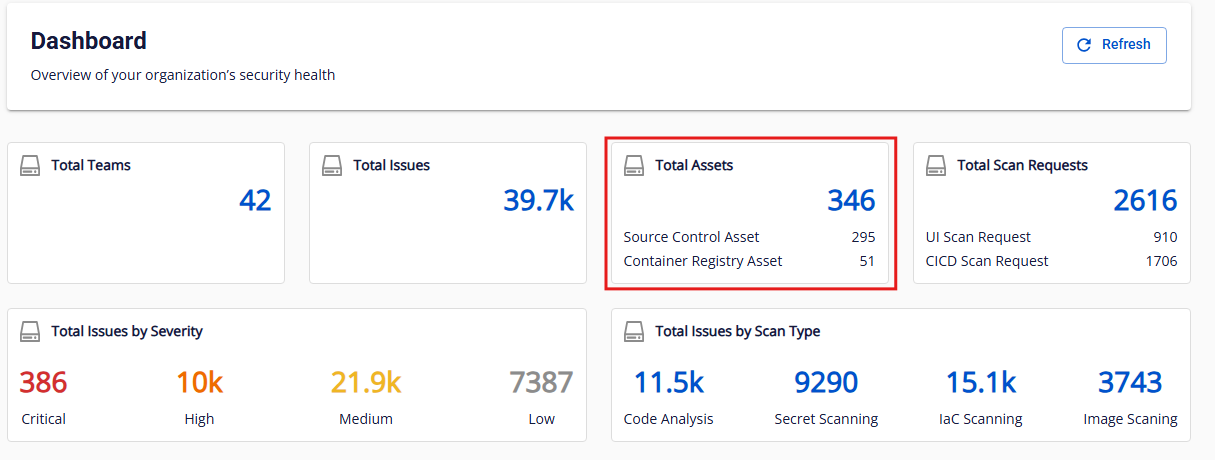
Total assets
Description: Total number of assets in the organization, including:
- Source control assets (GitHub, GitLab)
- Container registry assets (FCR, Harbor)
Display format: same as Total issues.
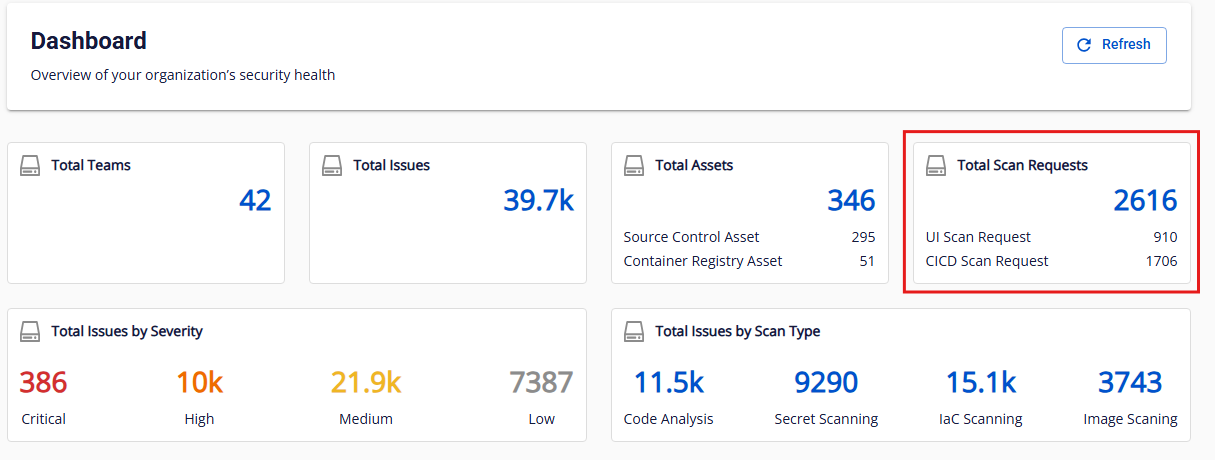
Total scan requests
Description: Total number of security scans run (Code + Secret + IaC + Image).
Categories:
- UI scan request
- CI/CD scan request
Display format: same as Total issues.
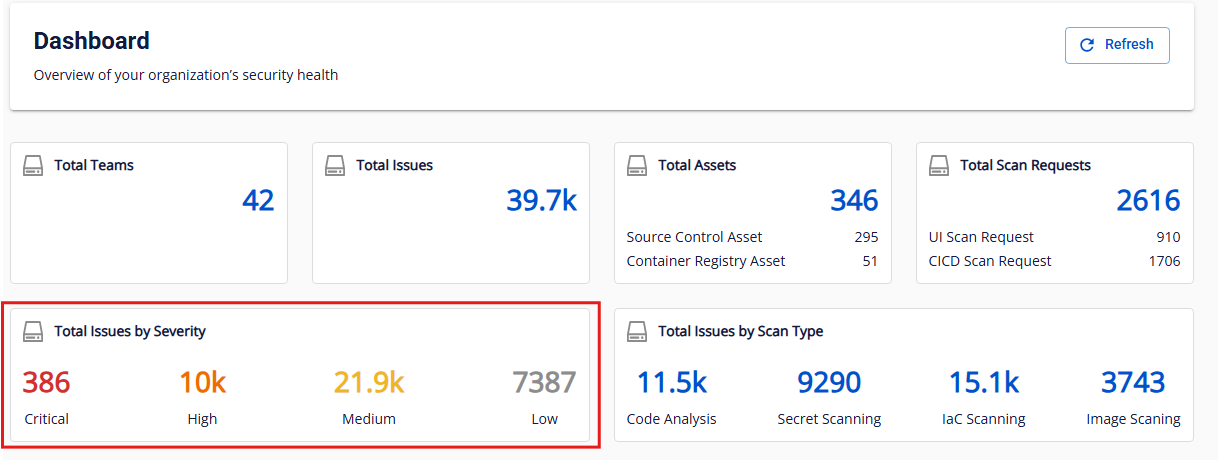
Total issues by severity
Description: Issue count broken down by four severity levels — Critical, High, Medium, Low — from the most recent successful scan.
Display format: same as Total issues.
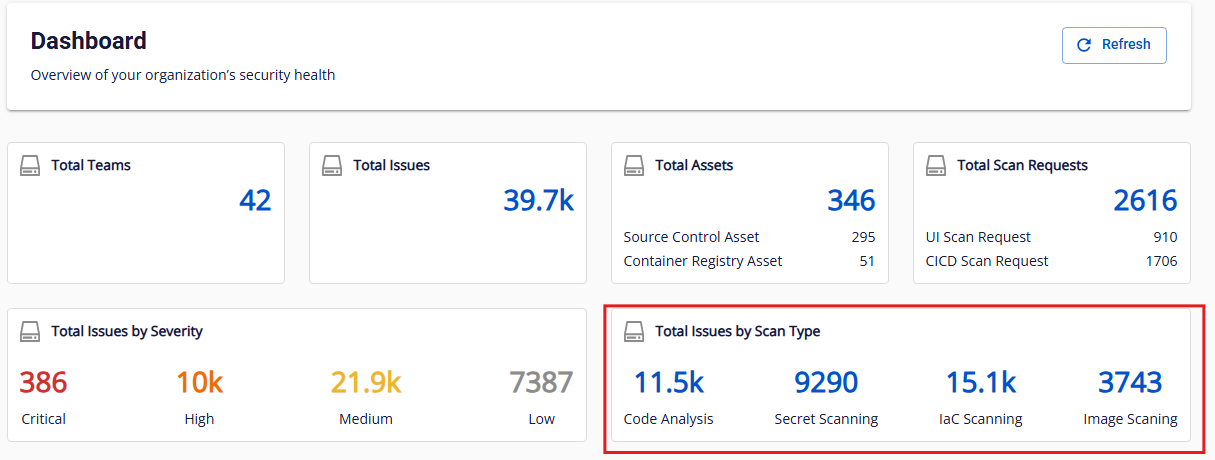
Total issues by scan type
Description: Issue count broken down by scan type:
- Code Analysis
- Secret Scanning
- IaC Scanning
- Image Scanning
Display format: same as Total issues.