Dashboard chart: Issues by team
This chart analyzes the number of issues per team, categorized by severity or scan type.
Note: Charts use data from the most recent successful scan. Click Refresh to reload data.
View modes
There are two charts by default:
- Issues by severity
- Issues by scan type
Each chart is a stacked bar chart showing issue counts per team.
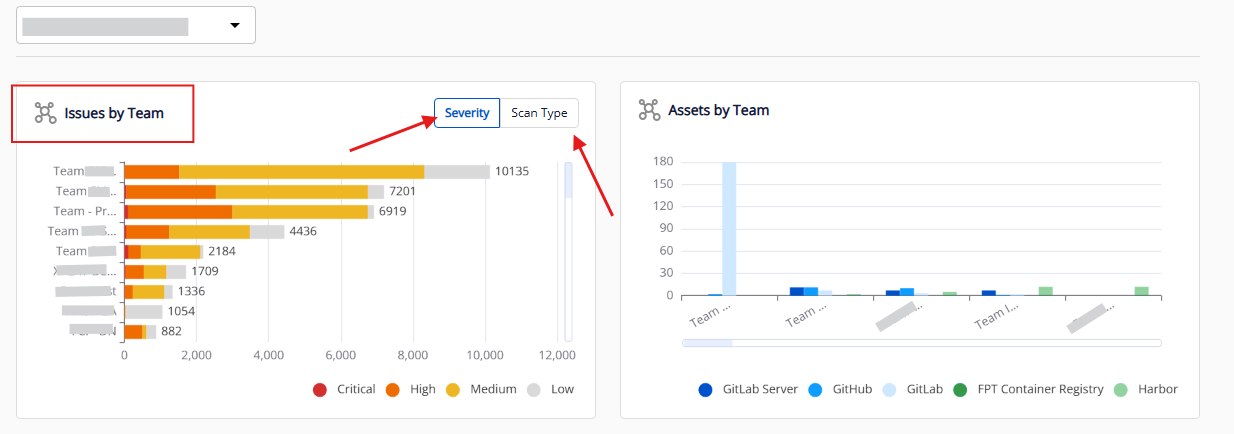
Chart structure
| Component | Description |
|---|---|
| Y axis | List of teams/sub-teams (based on Team filter) |
| X axis | Total number of issues |
| Legend | Severity: Critical, High, Medium, Low / Scan type: Code Analysis, Secret Scanning, IaC Scanning, Image Scanning |
| Data | Layered by severity level or scan type |
Filtering data
Use the legend options (bottom right):
- Click to show/hide data by severity level or scan type.
- For example, deselecting "Low" shows only Medium and above.
You can also apply a team filter at the top of the dashboard to narrow data to a specific department.