Monitoring
1. Connect to Monitoring Workspace
To integrate with Monitoring Workspace, follow these steps:
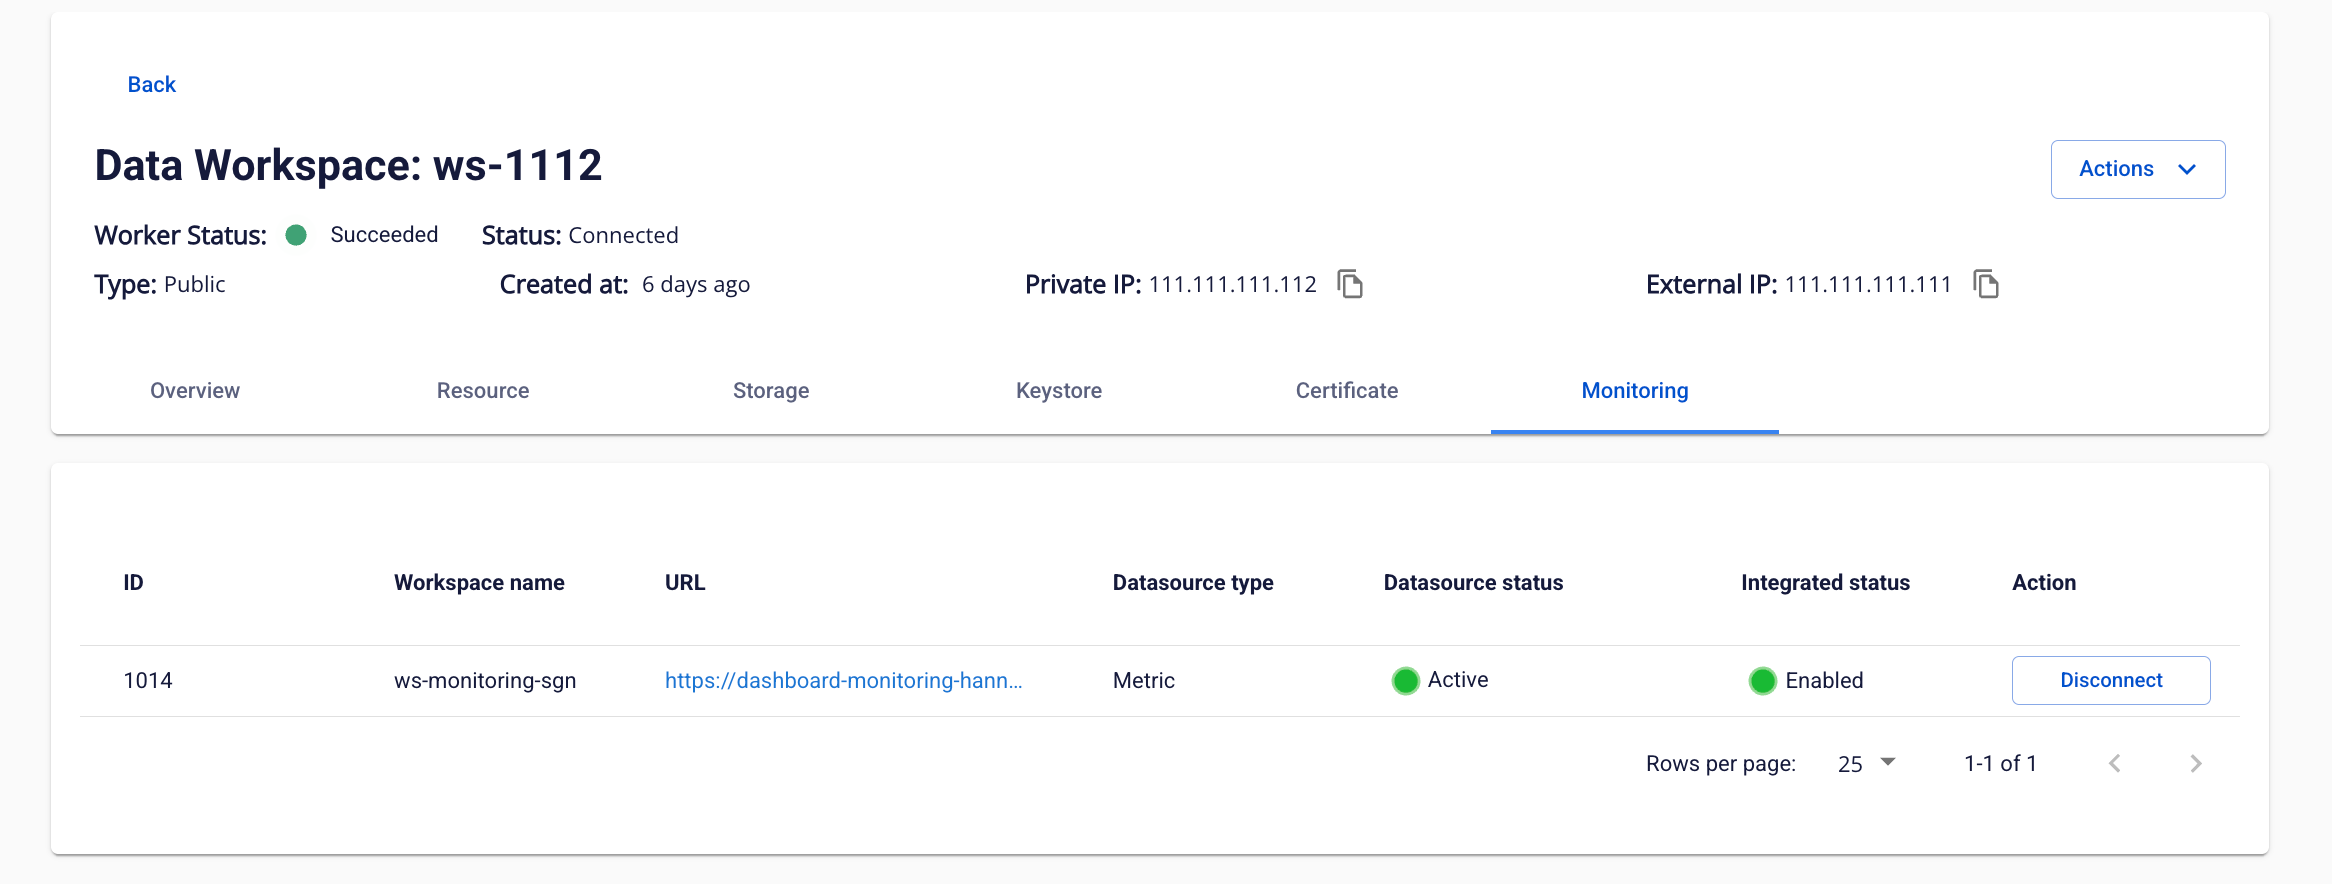
Step 1: On the Workspace Details screen, switch to the Monitoring tab
Step 2: In the Monitoring Workspace information table, review the following fields:
-
ID: Workspace ID
-
Workspace name: Workspace name
-
URL: URL to access the Monitoring Dashboard
-
Datasource type: Datasource type (Metric)
-
Datasource status: Datasource status (Activating, Active, Active Failed, Inactive, Deactivate Failed)
-
Integrated status: Integration status (Enabled/Disabled)
Step 3: Click the Integrate button in the Action column
Step 4: The system establishes a connection to the Monitoring Workspace
2. Configure and Use the Monitoring Dashboard
After a successful integration, to view and configure the Monitoring Dashboard, follow these steps:
A. Access the Monitoring Dashboard
Step 1: On the Workspace Monitor tab, click the URL in the Monitoring Workspace information table
Step 2: The system opens the Monitoring Dashboard in a new tab
B. Import Dashboard Template
Step 3: In the Monitoring Dashboard, select the left menu > Dashboards
Step 4: Click New > select New folder
Step 5: Enter a folder name (e.g., "Workspace Monitoring") > click Create
Step 6: Navigate into the newly created folder > click New > select Import
Step 7: On the Import Dashboard screen:
-
Click Upload JSON file or drag and drop the dashboard template file
-
The dashboard template file is provided by the system (in .json format)
Step 8: After a successful upload:
-
Verify the dashboard information (Name, UID, Folder)
-
Select the Datasource corresponding to the integrated API Gateway
-
Click Import to complete
Step 9: The dashboard is created and displays the service metrics