Using GPU telemetry
FPT Cloud uses NVIDIA GPU Telemetry integrated with kube-prometheus-stack as the monitoring and observability toolset for GPU-based systems on Kubernetes. The monitoring stack includes a collector, a time-series database for storing metrics, and a visualization layer. It uses the popular open-source applications Prometheus and Grafana. Prometheus also includes Alertmanager for creating and managing alerts. Prometheus is deployed together with kube-state-metrics and node_exporter to display cluster-level metrics for Kubernetes API objects and node-level metrics such as GPU utilization.
Check GPU custom metrics with the following command:
kubectl get --raw /apis/custom.metrics.k8s.io/v1beta1 | jq -r . | grep DCGM
Access Prometheus to check GPU DCGM metrics:
kubectl port-forward service/kube-prometheus-stack-1679-prometheus 9090:63090

http://localhost:63090/
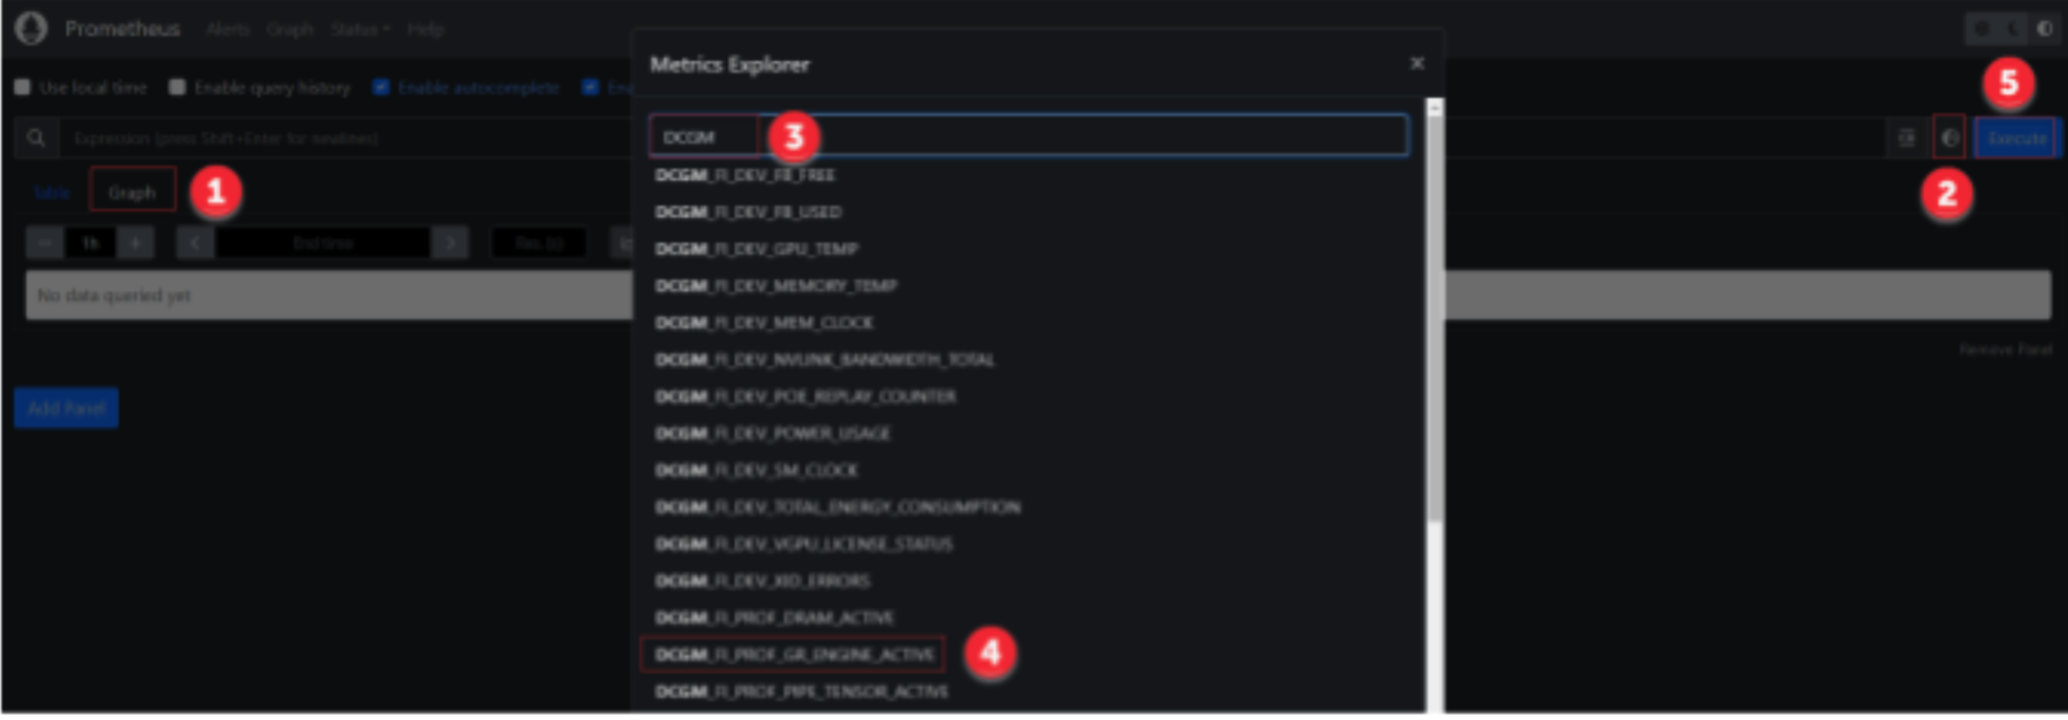
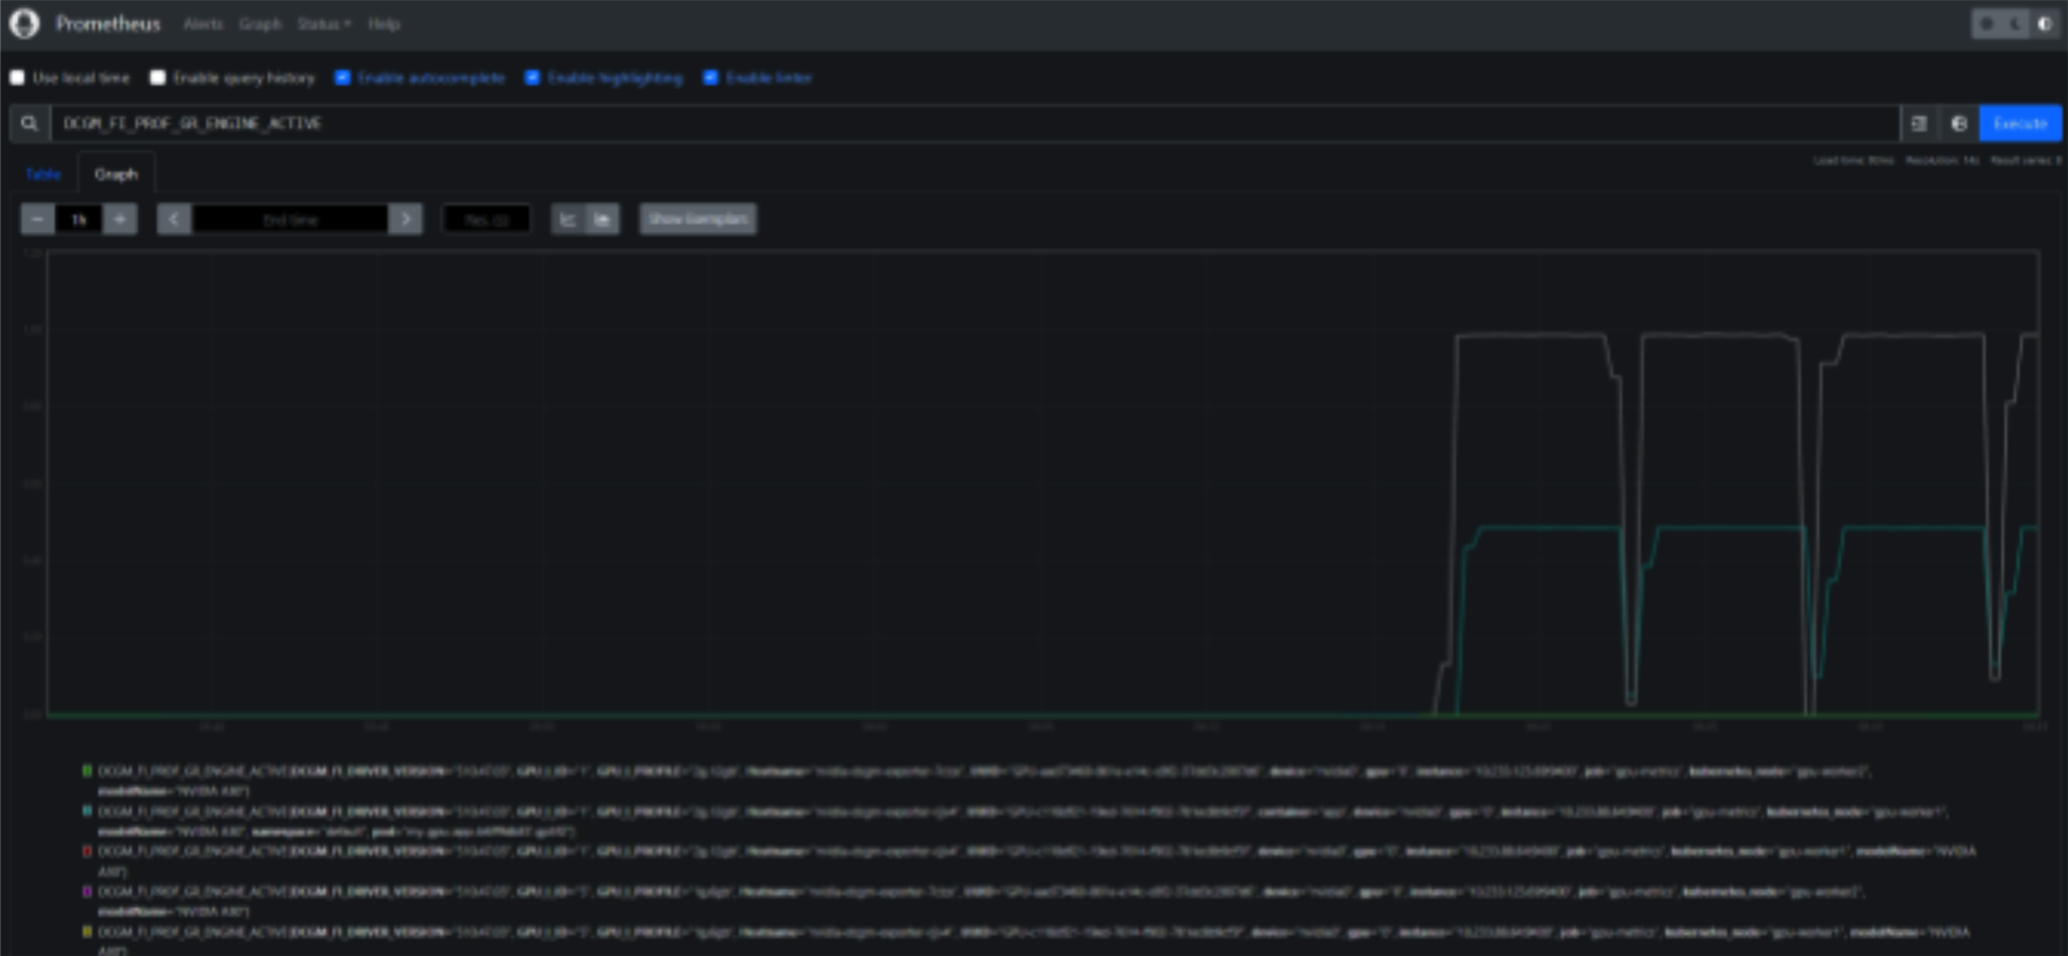
On the Prometheus interface, follow the steps shown below to check GPU DCGM metrics:
Access Grafana Dashboard:
kubectl port-forward service/kube-prometheus-stack-1679050354-grafana 80:63080

http://localhost:63080/
Default credentials for logging in to Grafana:
- User: admin
- Password: prom-operator
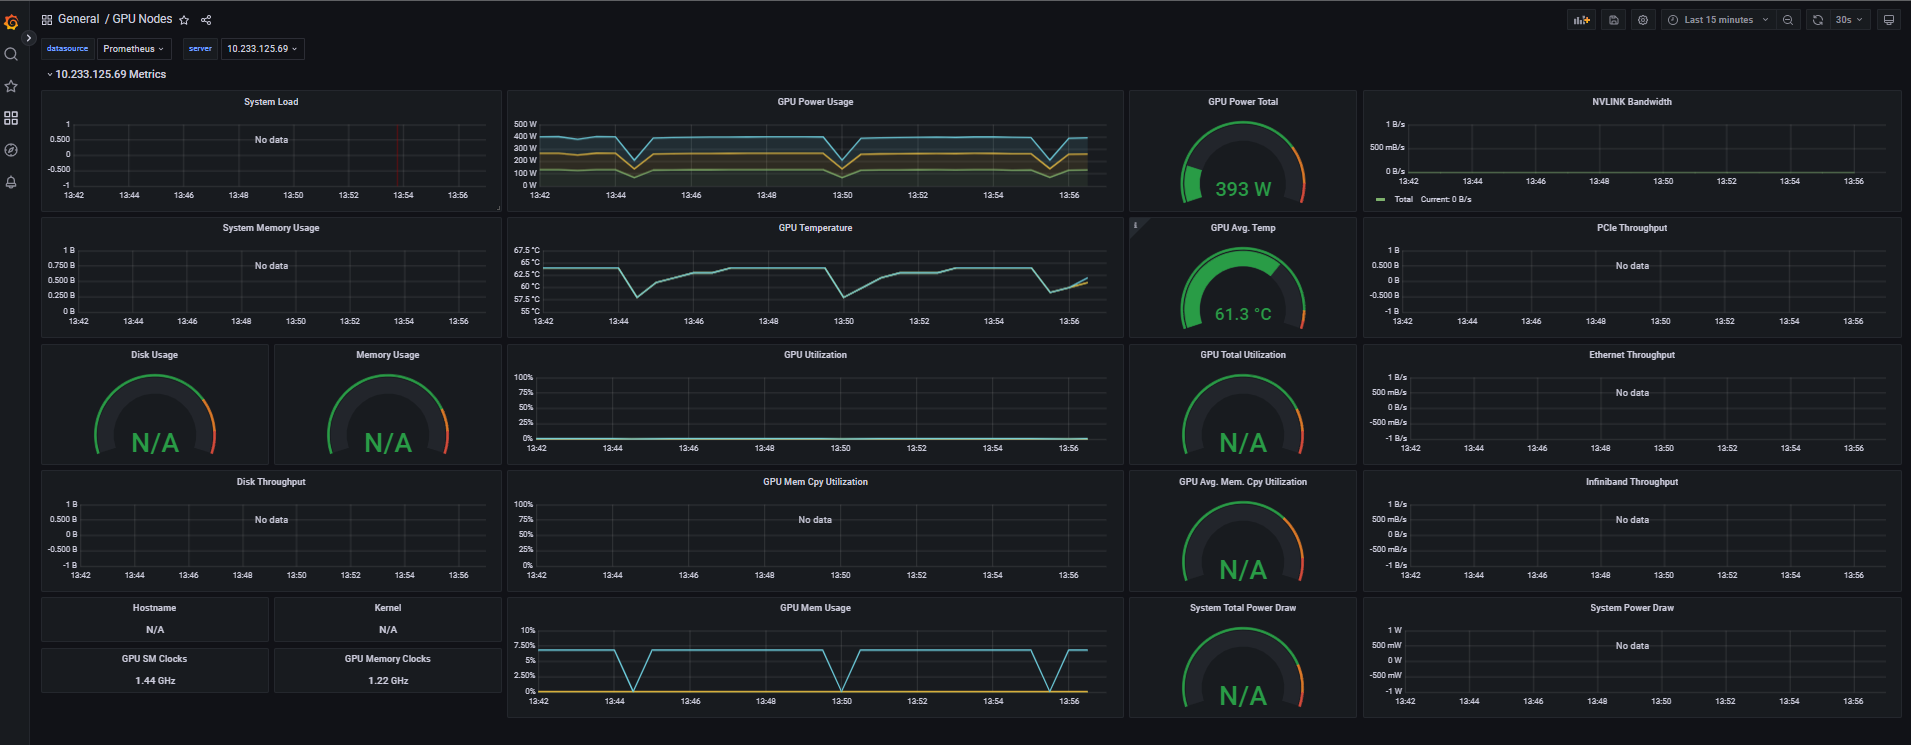
Import a Grafana Dashboard for GPU:
To import a dashboard, go to the Grafana interface, navigate to Dashboards > Manage > Import. If using the FPT Cloud dashboard, paste the FPT Cloud GPU Dashboard JSON content and click Load.
FPT Cloud GPU Dashboard: