Monitor WAF server with Dashboard Overview
The Home dashboard is an overview page that lets administrators monitor WAF server parameters and statistics in real time.
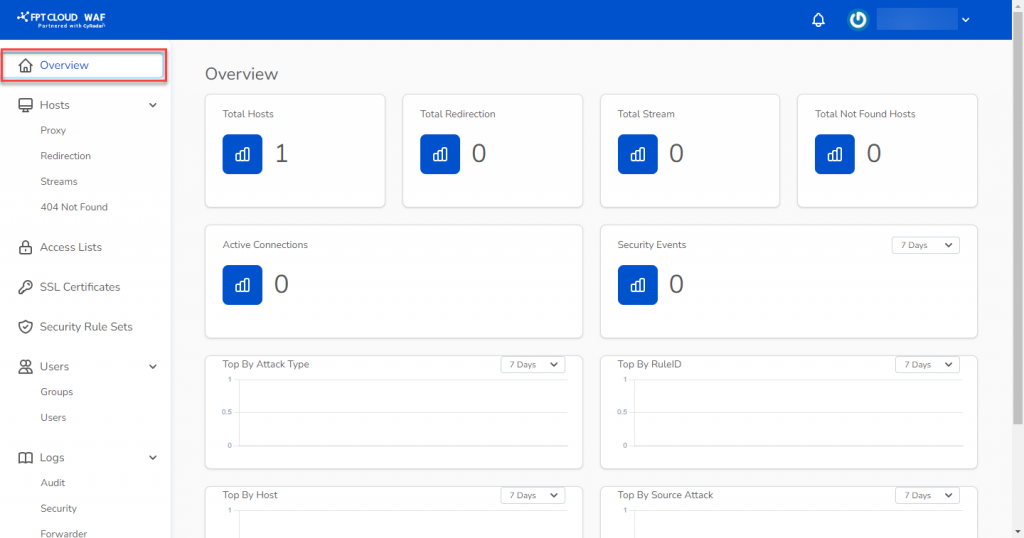
In WAF Dashboard, select Overview. The screen displays continuously updated metrics:
| Metrics | Description |
|---|---|
| Total Hosts | Number of proxy hosts created |
| Total Redirection | Number of redirection hosts created |
| Total Stream | Number of stream hosts created |
| Total Not Found Hosts | Number of 404 Not Found hosts created |
| Active Connections | Number of active connections to proxy hosts |
| Security Events | Total security events blocked and recorded by WAF |
| Top By Attack Type | Most frequent attack types blocked by WAF |
| Top By RuleID | Most frequently violated rule IDs |
| Top By Host | Proxy hosts with the most security events recorded |
| Top By Source Attack | IP addresses that are the most frequent attack sources |