Audit Log
The Audit Log is a security feature provided as a self-service on the Unify portal for the MFKE product. It records all activity and API requests sent to the kube-apiserver, enabling you to track which actor performed what action, when, which objects were affected, and the result of the action.
Benefits of Audit Log:
- Monitors the activity of components interacting with the Kubernetes cluster API server.
- Provides security analysis capability and detection of abnormal behavior.
- Supports incident tracing and compliance.
The Audit Log structure includes the following fields:
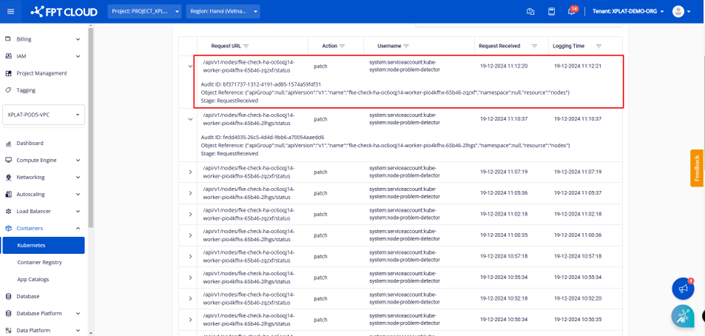
- Request URL: The API endpoint path called on the kube-apiserver.
- Audit ID: A unique ID for each audit event, used for log tracing.
- Object Reference: Information about the Kubernetes resource being operated on:
- ApiGroup
- apiVersion: API version (e.g. v1)
- name: Name of the resource
- Namespace
- resource: Resource type (e.g. nodes)
- Action: The operation performed on the Kubernetes resource (e.g. patch/create/delete/update).
- Username: The name of the account or service that performed the action.
- Request Received: The time the request was recorded by the kube-apiserver (format: dd-MM-yyyy HH:mm:ss).
- Logging Time: The time the event was recorded in the MFKE service log system. Logging Time is usually later than Request Received due to the time taken to push logs from the cluster's kube-apiserver to the centralized log system.
Using the feature on Unify Portal
Note: The security enhancement features for Managed Kubernetes Cluster are integrated after the cluster is successfully created (status: Succeeded/Running).
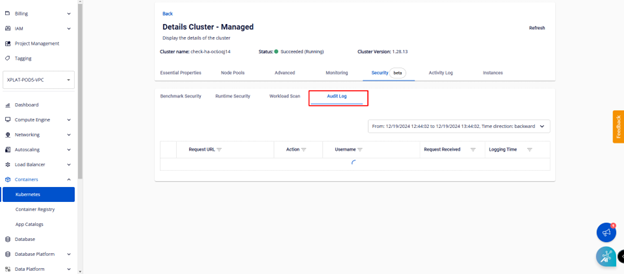
1. Enable the Audit Log Security feature:
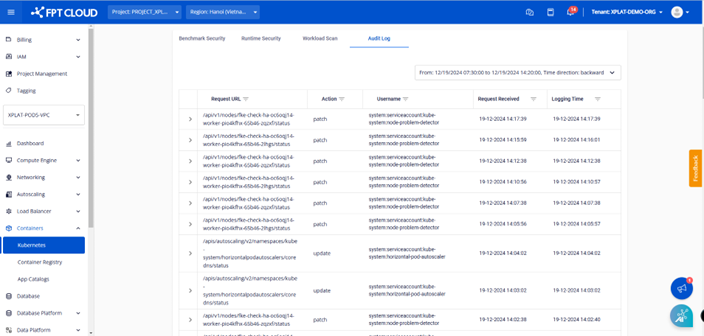
Go to FPT Cloud portal console.fptcloud.com, select Kubernetes, click on the cluster you want to audit, go to the Security tab, then select the Audit Log tab.
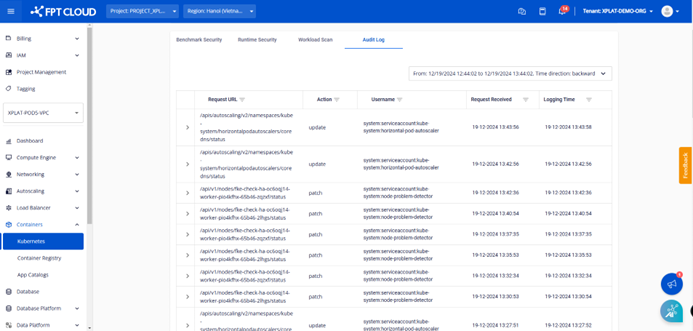
After clicking the Audit Log tab, the screen automatically queries and displays all logs recorded in the last 1 hour. Audit log information is displayed with the fields described above.
2. To search logs in a different time range:
- Step 1: Click the time picker in the upper right corner of the screen.
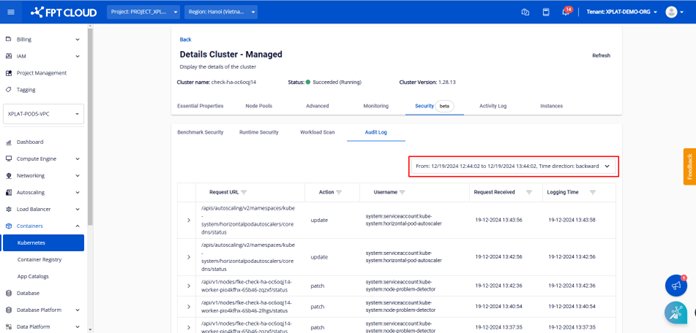
- Step 2: Enter the time range you want to display logs for and click Apply Filter.
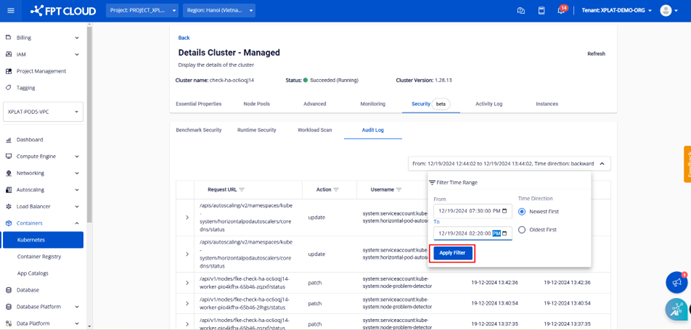
The system displays all logs recorded in the selected time range, sorted in descending order by time.
Notes:
- You can only filter logs within a maximum time range (From – To) of 3 days.
- Logs are retained for the last 7 days.