Monitoring
The Monitoring feature provides real-time observability into the operational status, performance, and resource usage of databases on FPT Cloud. Monitoring collects and visualizes important metrics and logs to help:
- Detect anomalies early.
- Evaluate query load.
- Proactively make decisions to optimize performance and availability.
Monitoring in FPT Database Engine is integrated with the FPT Monitoring system to collect metrics and logs, and provides dashboards and alerts when needed.
This guide describes how to access, configure, and use Monitoring to track the health and performance of database clusters on FPT Cloud Portal.
Step 1: Access the feature
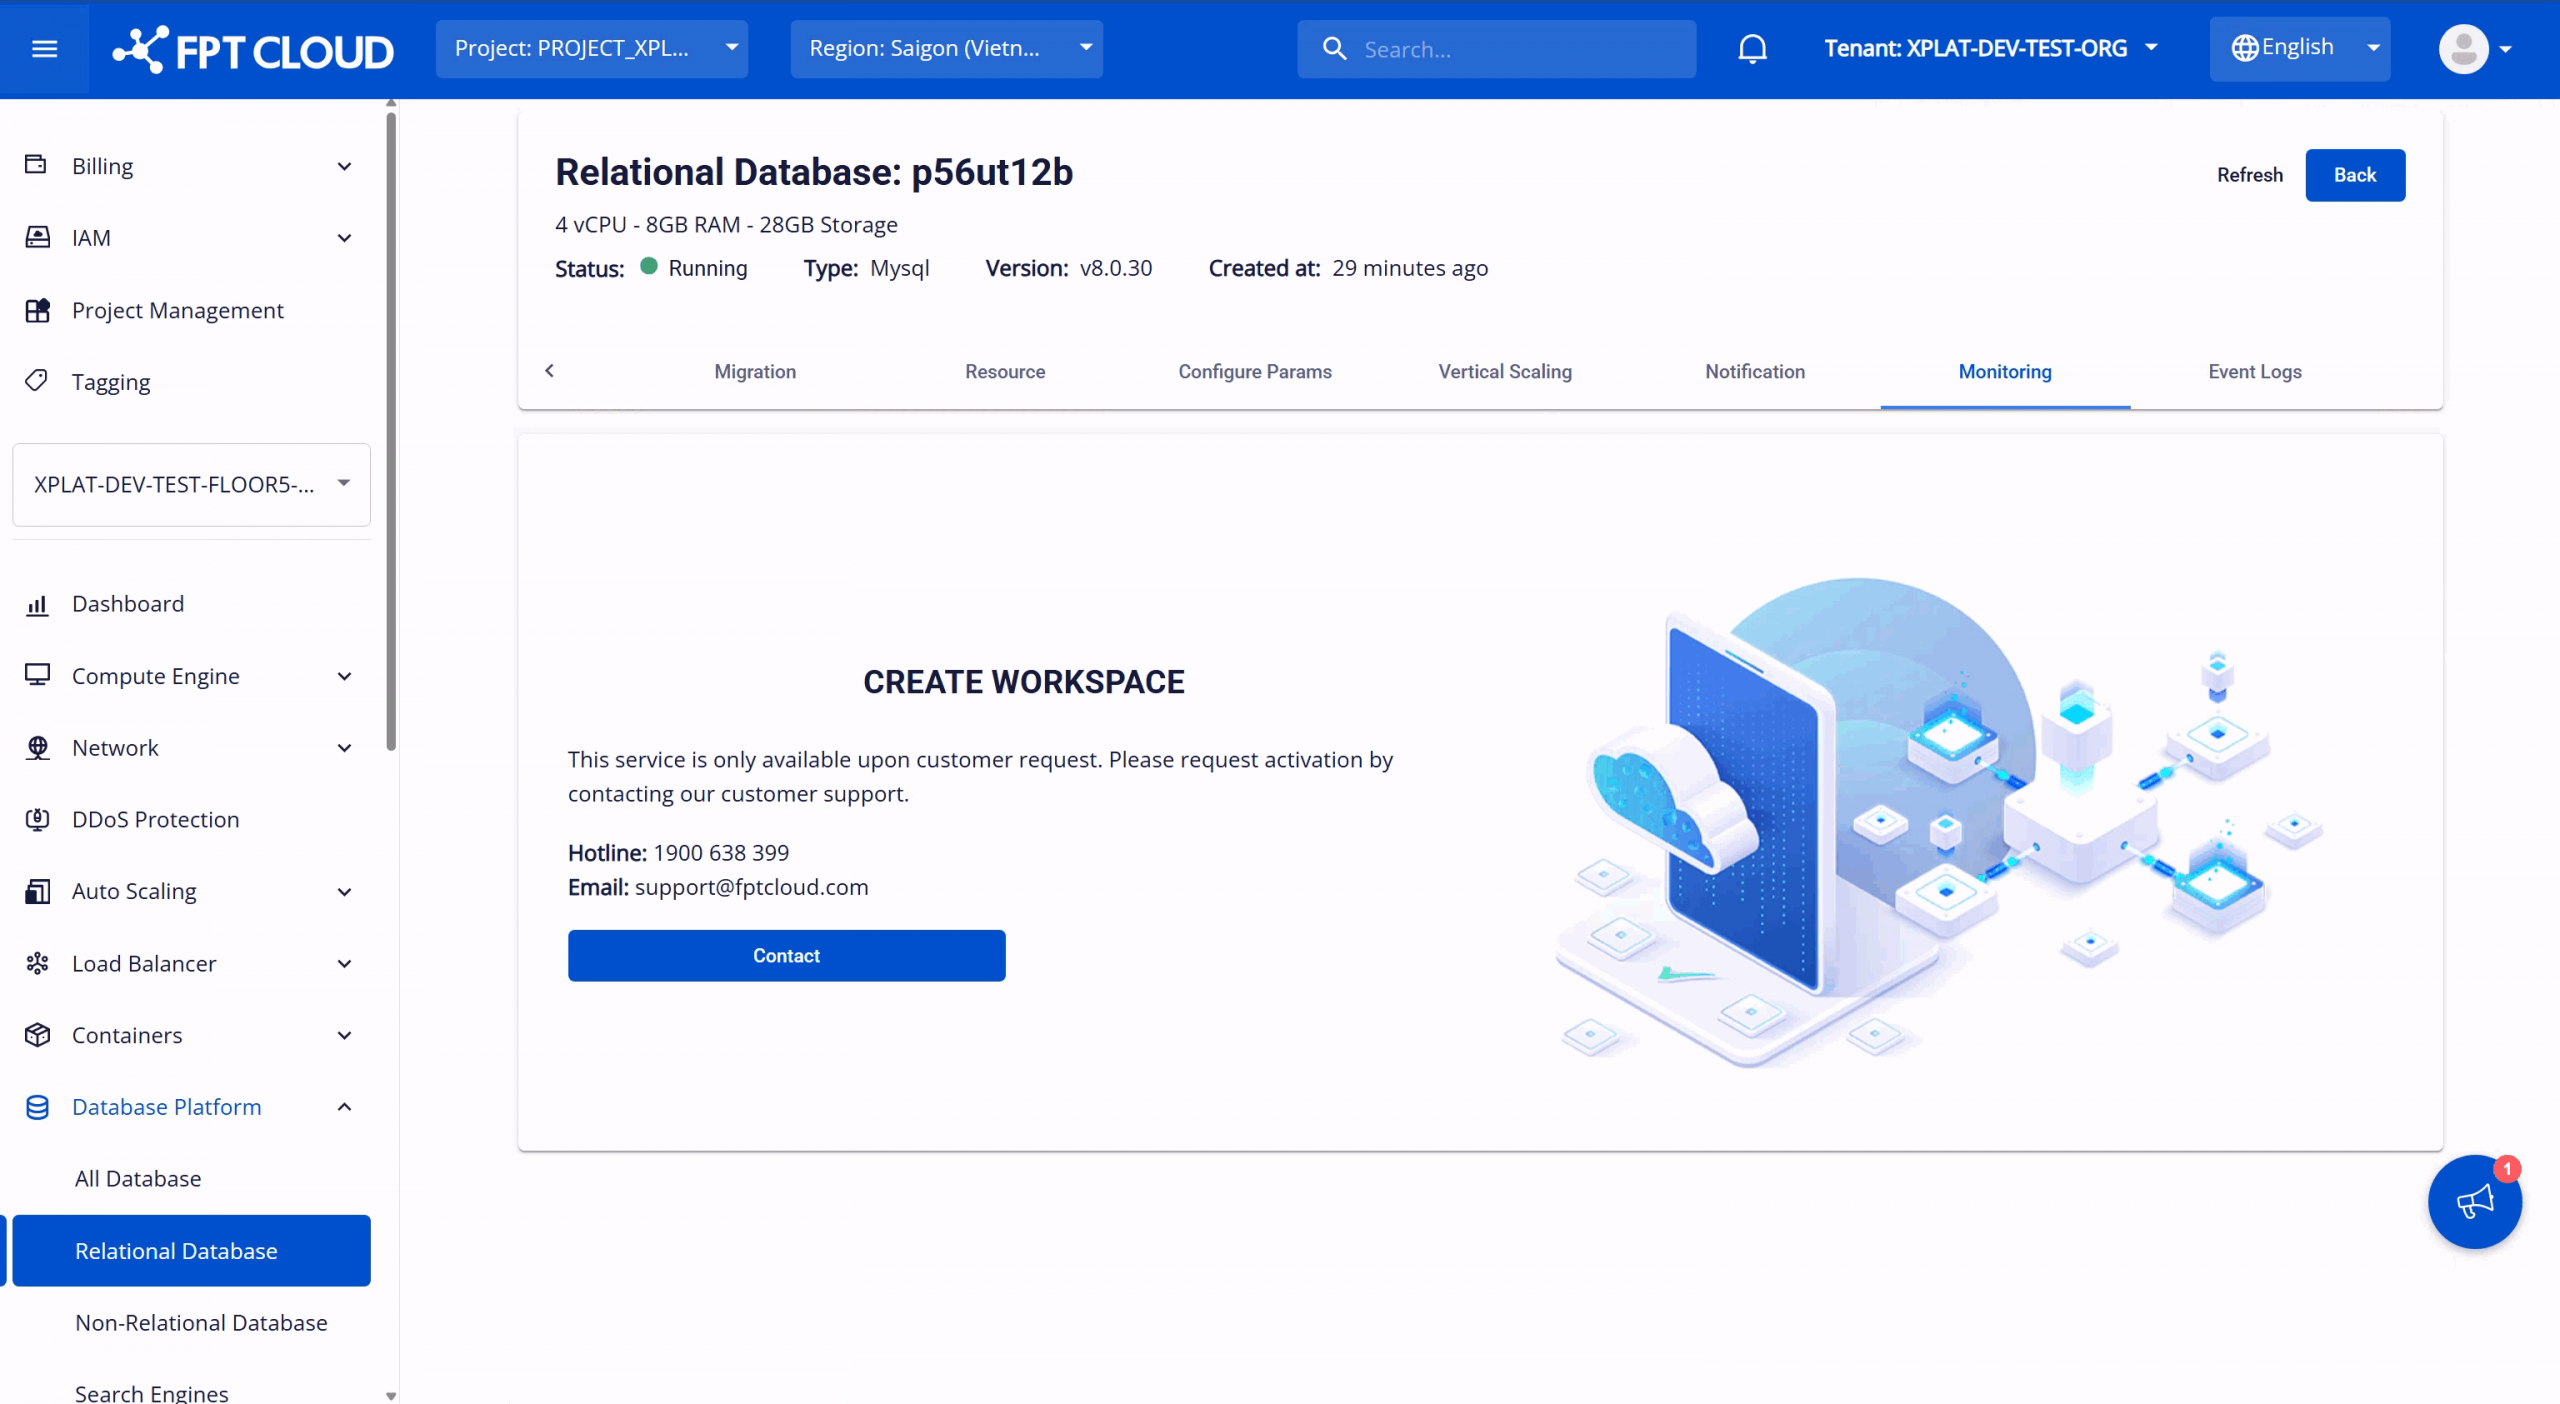
Log in to FPT Cloud Portal. From the main menu, select "Database Platform" → "All Database". On the Database list page, select the database cluster to monitor > select the "Monitor" tab to access the feature. Depending on the Monitoring activation status, the screen displays as follows:
- Monitoring not activated: The system displays a screen requesting contact with FPT Support. Customers need to contact the support team to activate Monitoring.
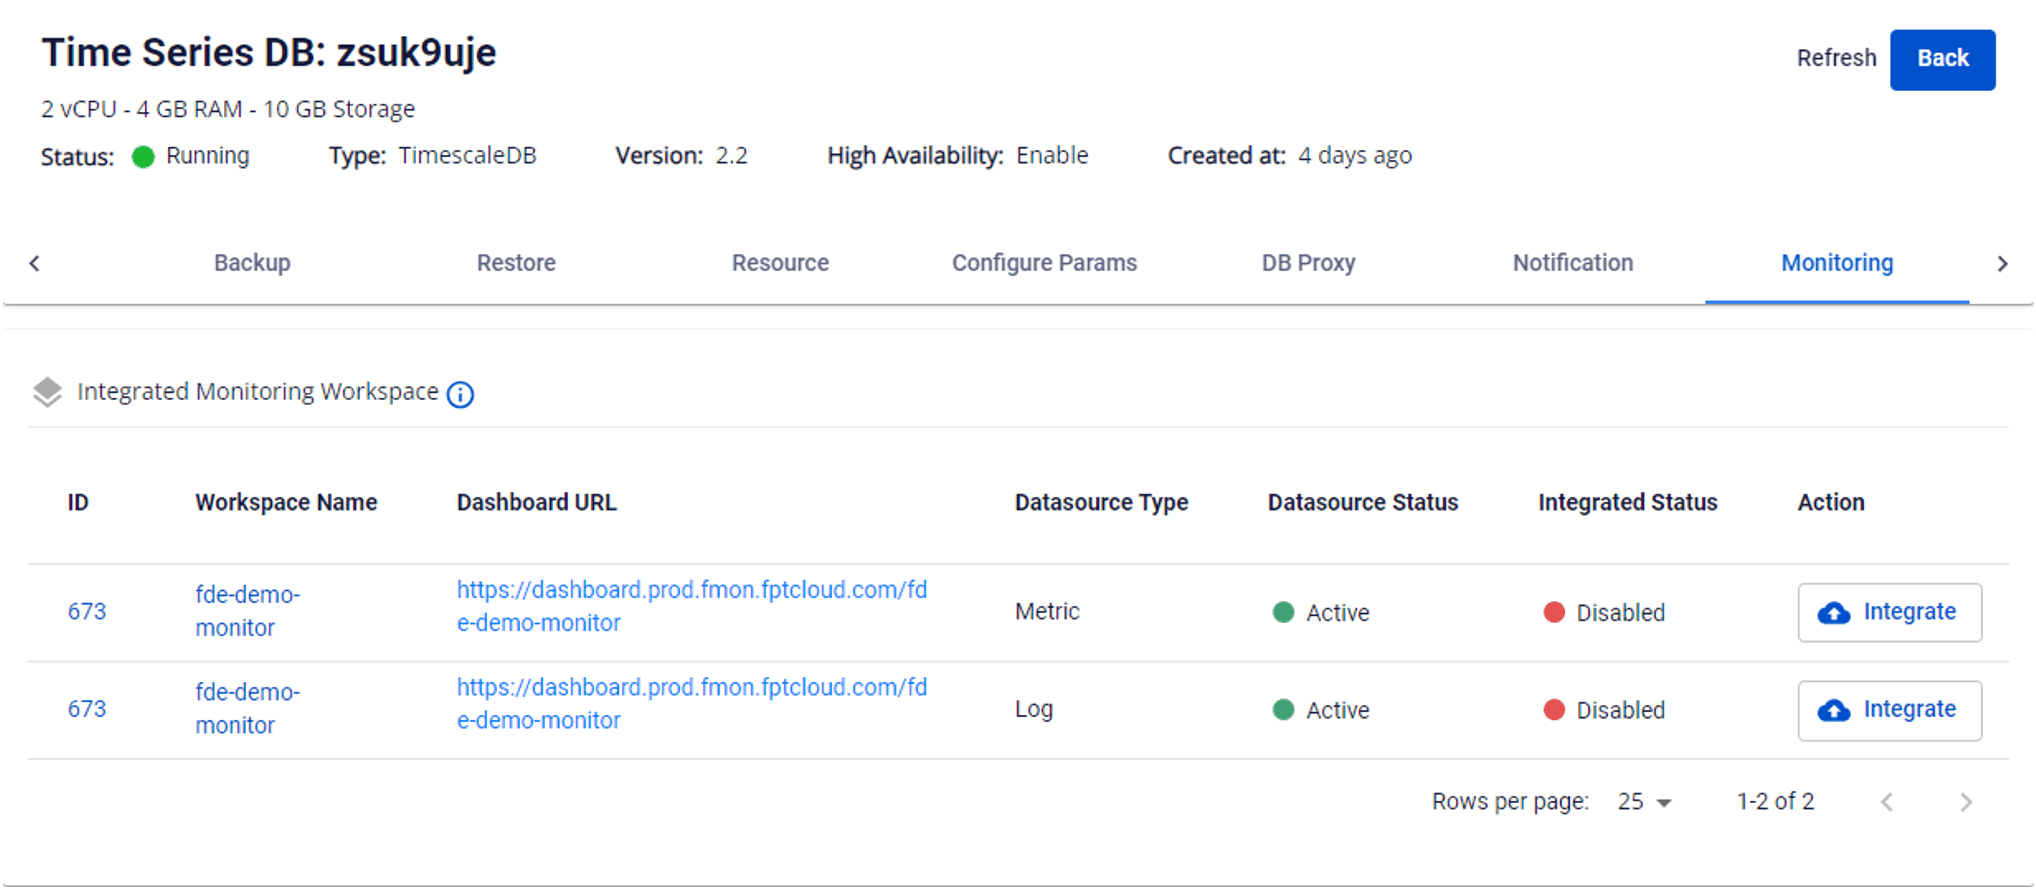
- Monitoring activated: The system displays the list of metrics and logs by database type. Metrics or logs not yet integrated with FPT Monitoring will have Integrated Status = "Disabled".
Step 2: Integrate/disintegrate monitoring
- Integrate monitoring: Enable metrics/logs collection for the database cluster. To do so, on the Workspace List, select the "Integrate" action for the workspace to monitor. Confirm the action in the warning dialog to complete. After successful integration, Integrated Status will change to "Enabled" and the FPT Monitoring system will begin collecting the corresponding metrics.
- Disintegrate monitoring: Disable metrics/logs collection for the database cluster. To do so, on the Workspace List, select the "Disintegrate" action for the workspace to stop monitoring. Confirm the action in the warning dialog to complete. After successful disintegration, Integrated Status will change to "Disabled" and the FPT Monitoring system will stop collecting the corresponding metrics.
Step 3: View workspace information
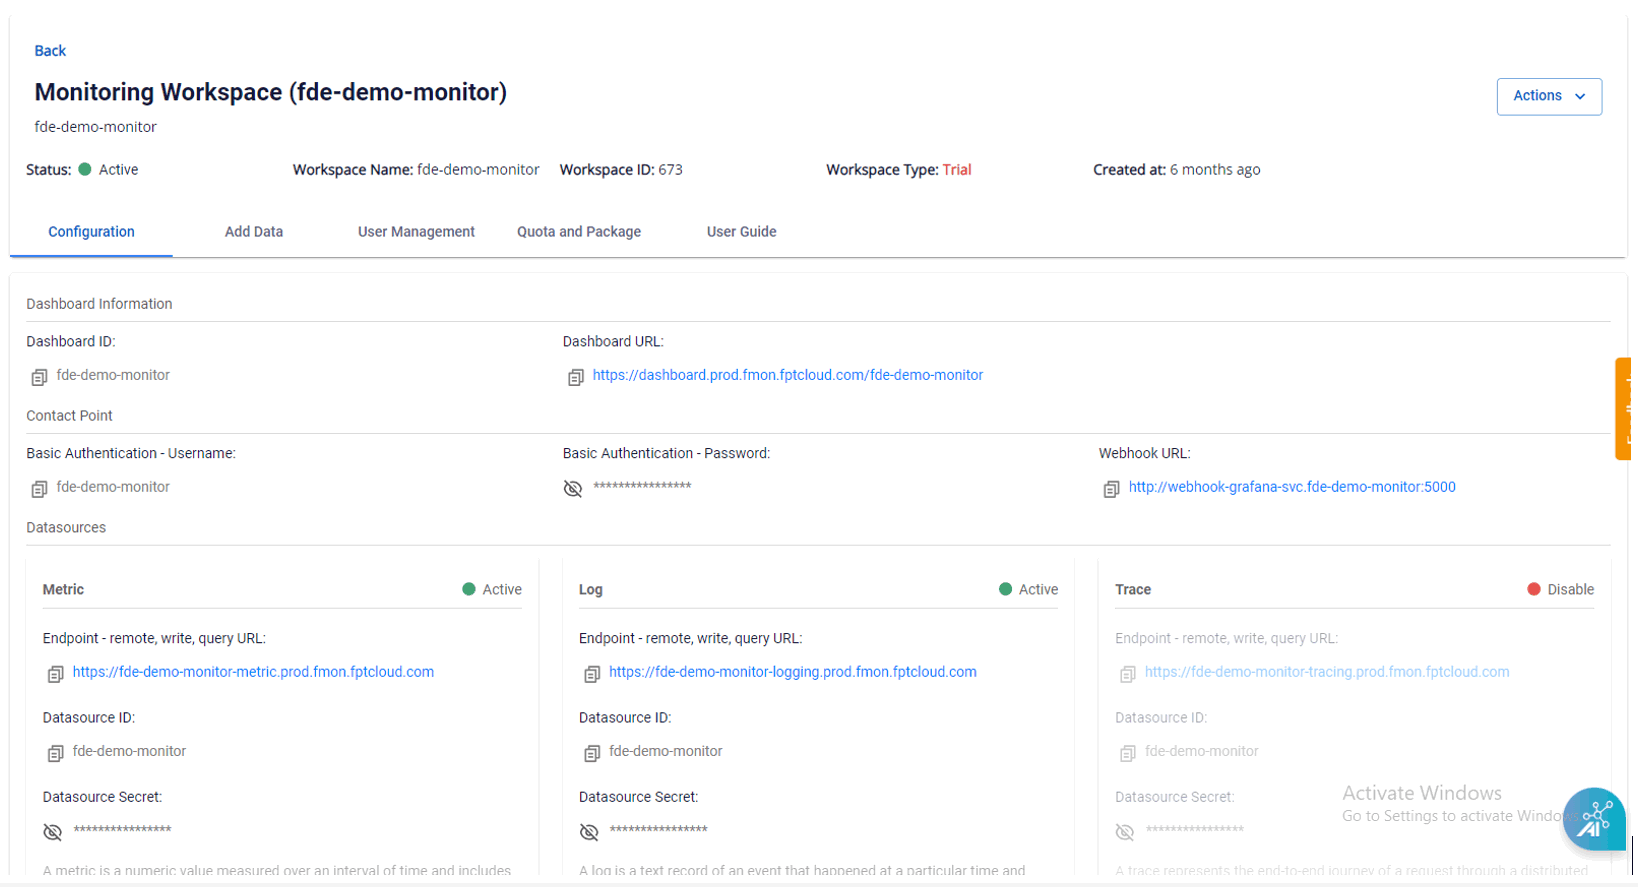
After successful monitoring integration (Integrated Status = "Enabled"), click the workspace name to open the workspace detail page. Here you can view related information: Monitoring dashboards, Contact points, and Datasources.
Step 4: View monitoring information
You can view dashboards displaying real-time metrics and historical data on Grafana by clicking the Dashboard URL to navigate to the login page:
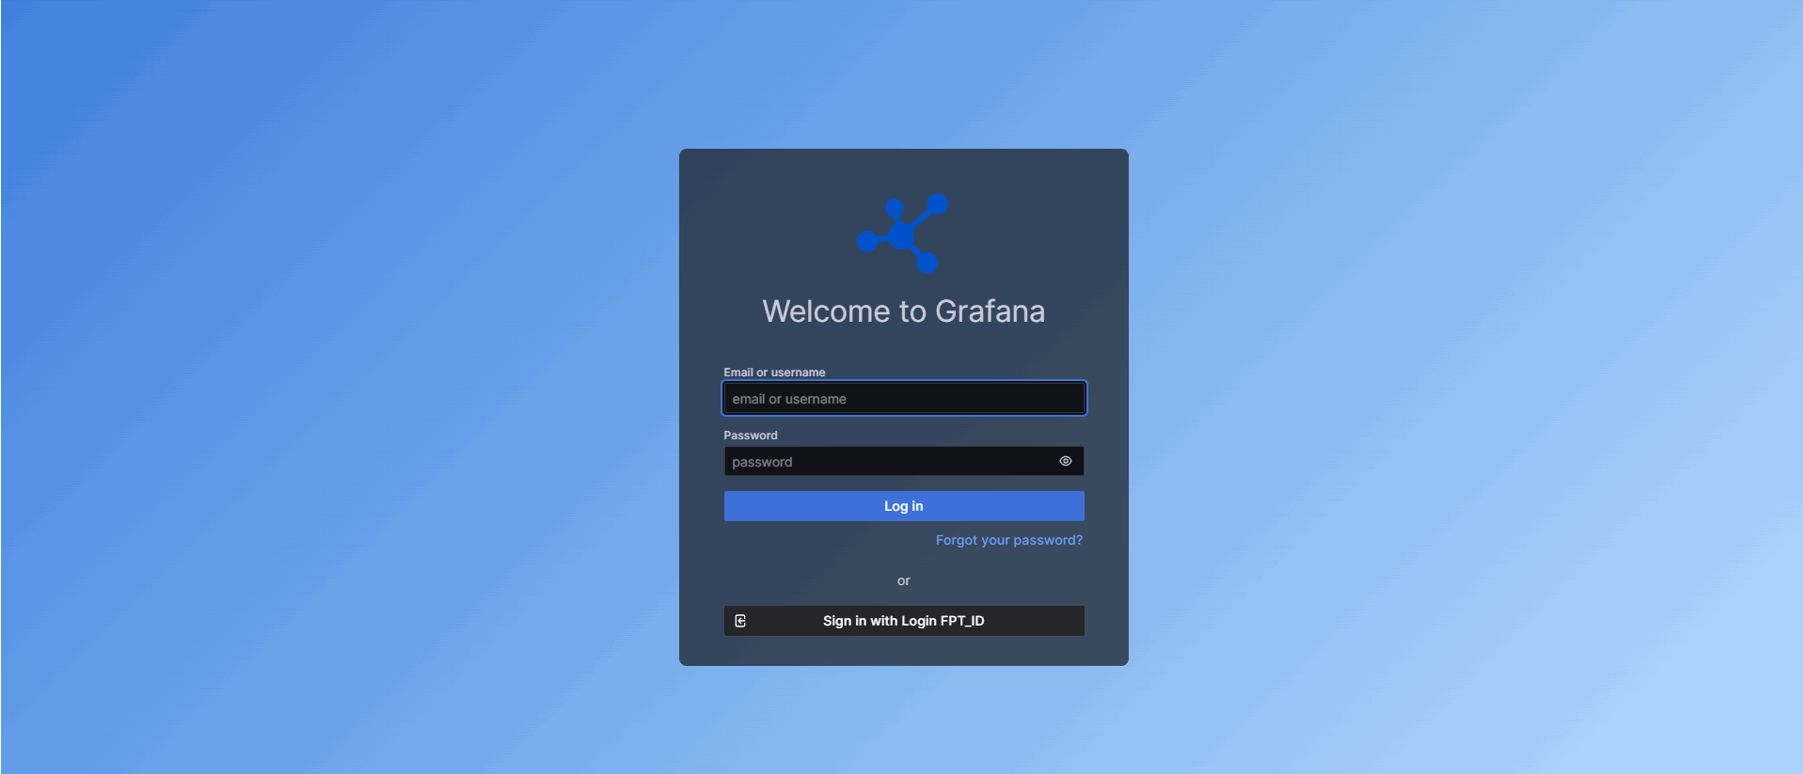
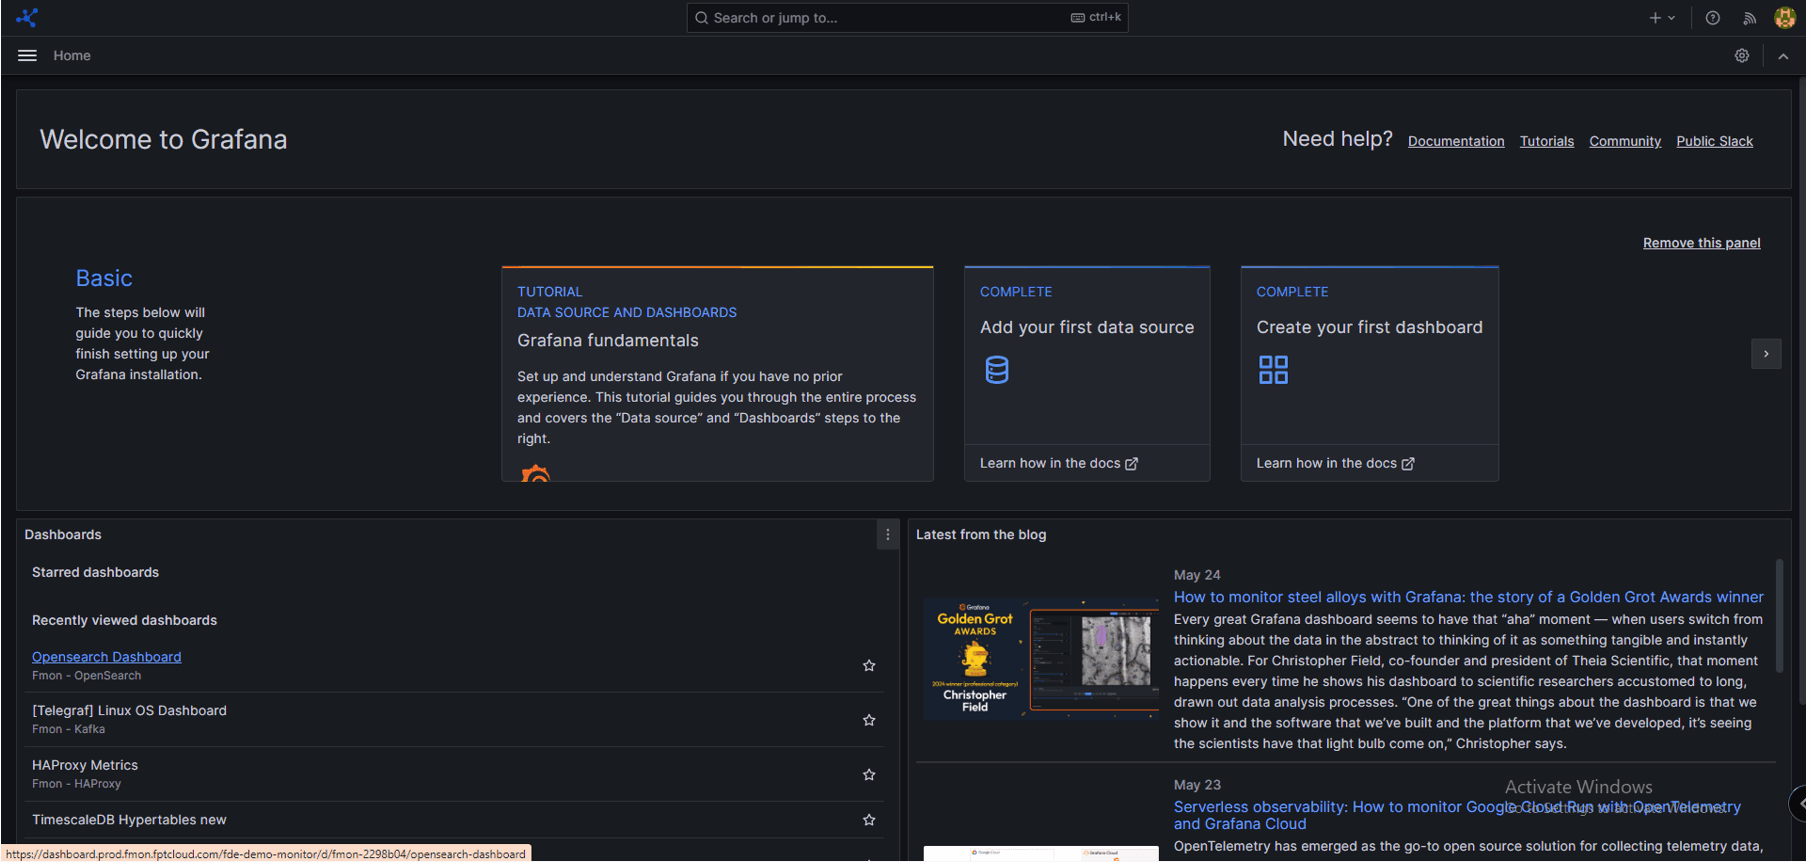
Enter the credentials Basic Authentication – Username and Basic Authentication – Password provided on the workspace detail page, then click Login to access the Grafana home page:
View metrics
Click "Toggle Menu" > select "Dashboards". The Dashboards screen is displayed. Select the Template corresponding to the database engine type to view the available folders.
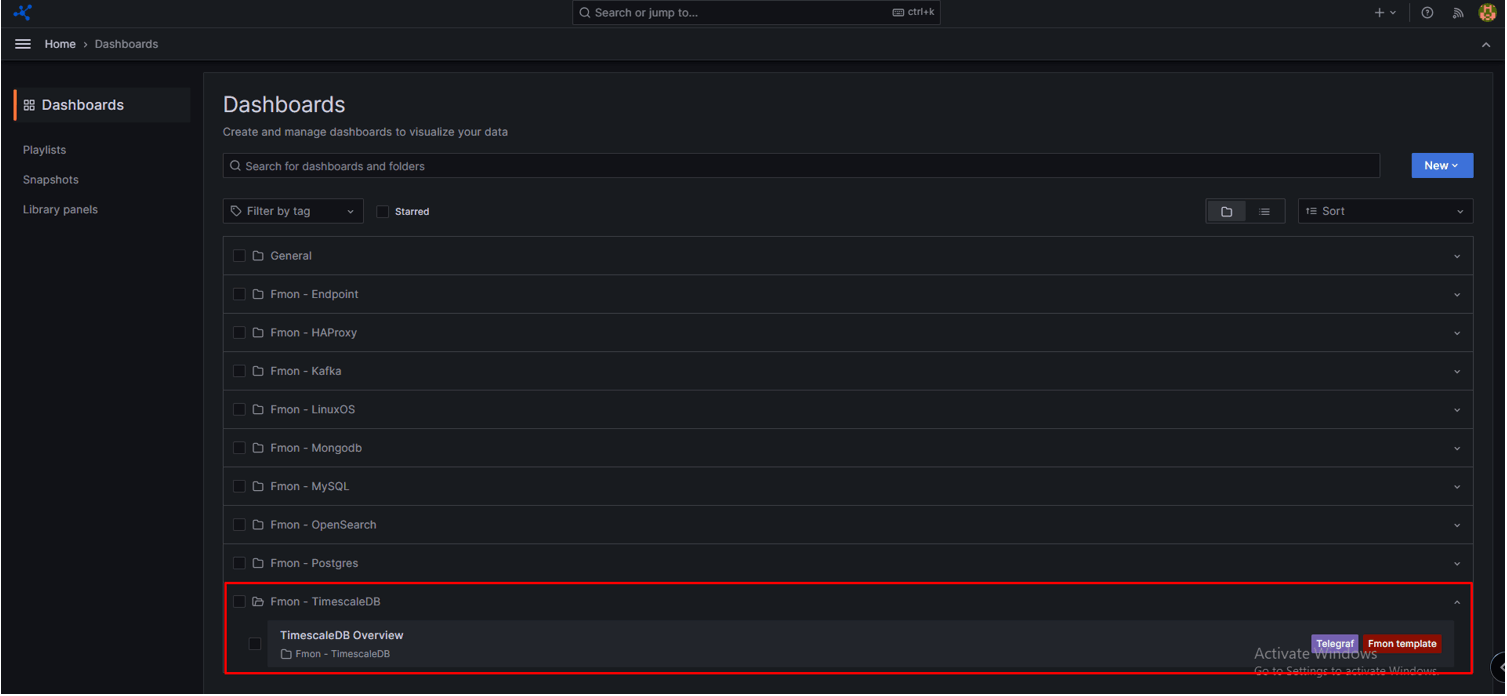
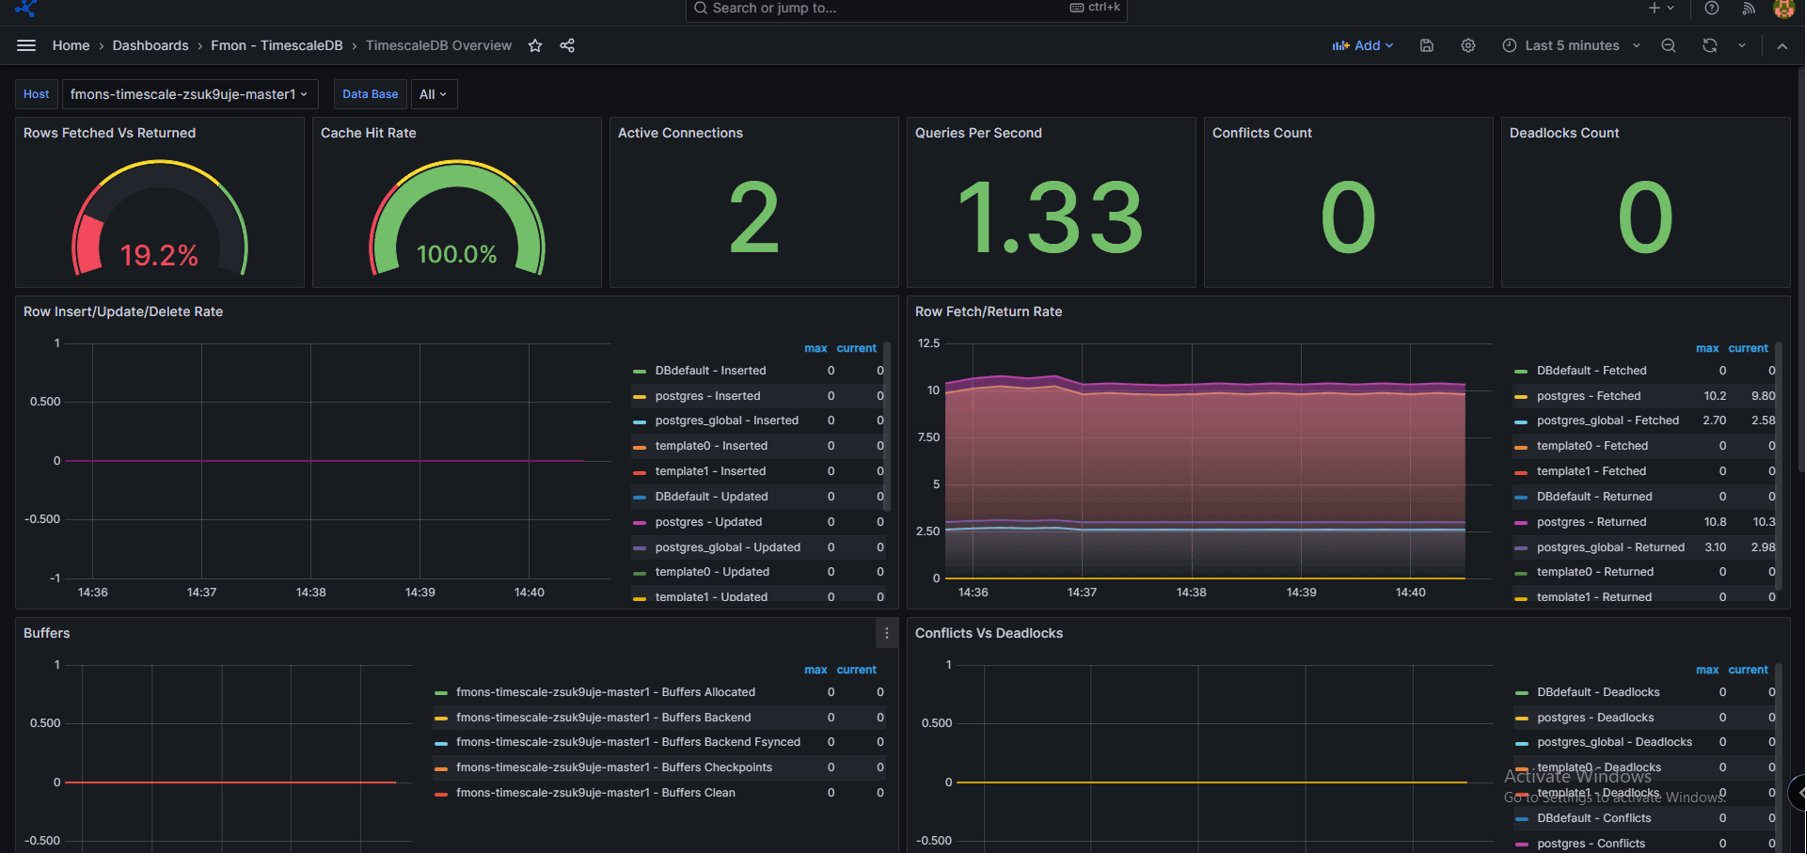
Select the folder to view to display the metrics:
View logs
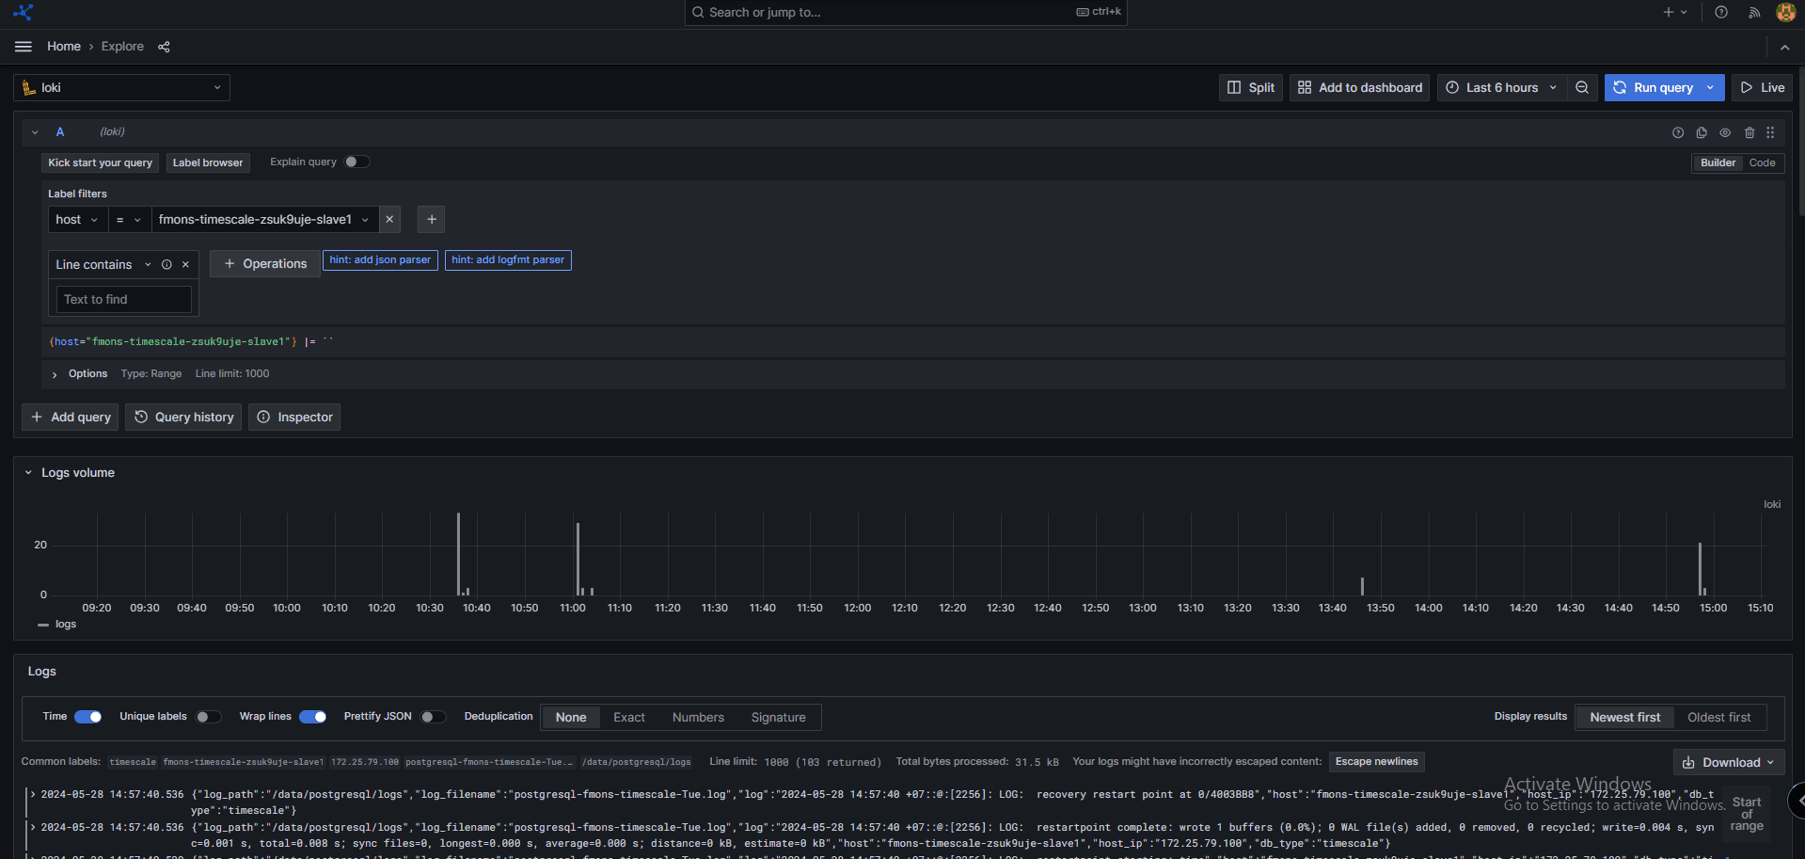
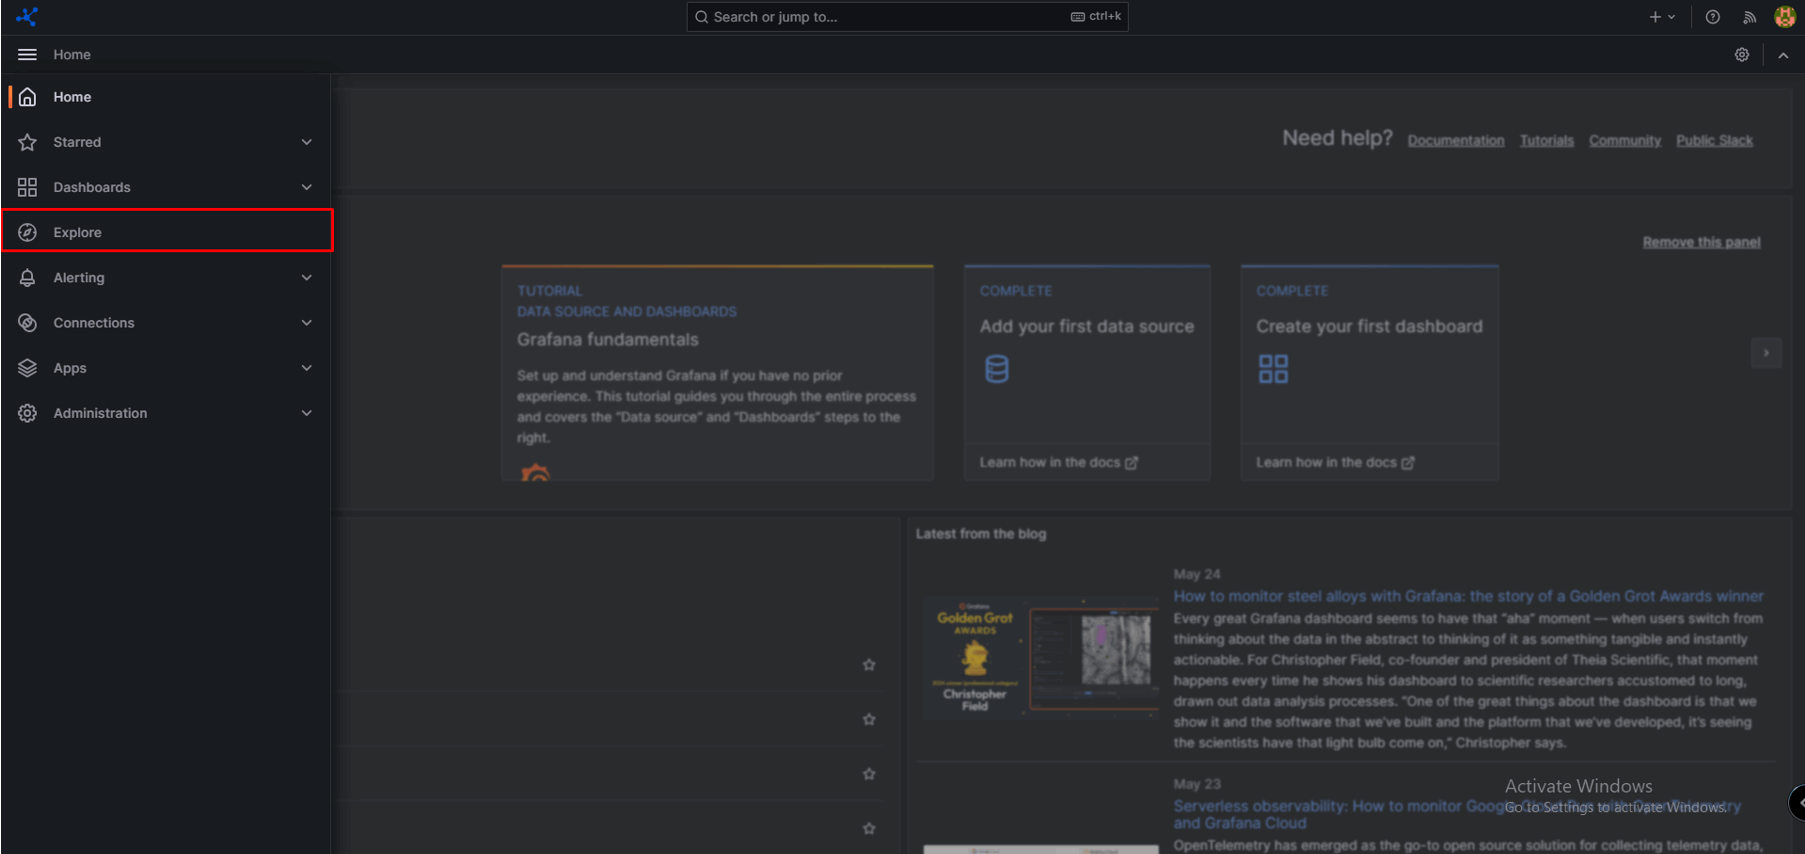
Click "Toggle Menu" > select "Explore":
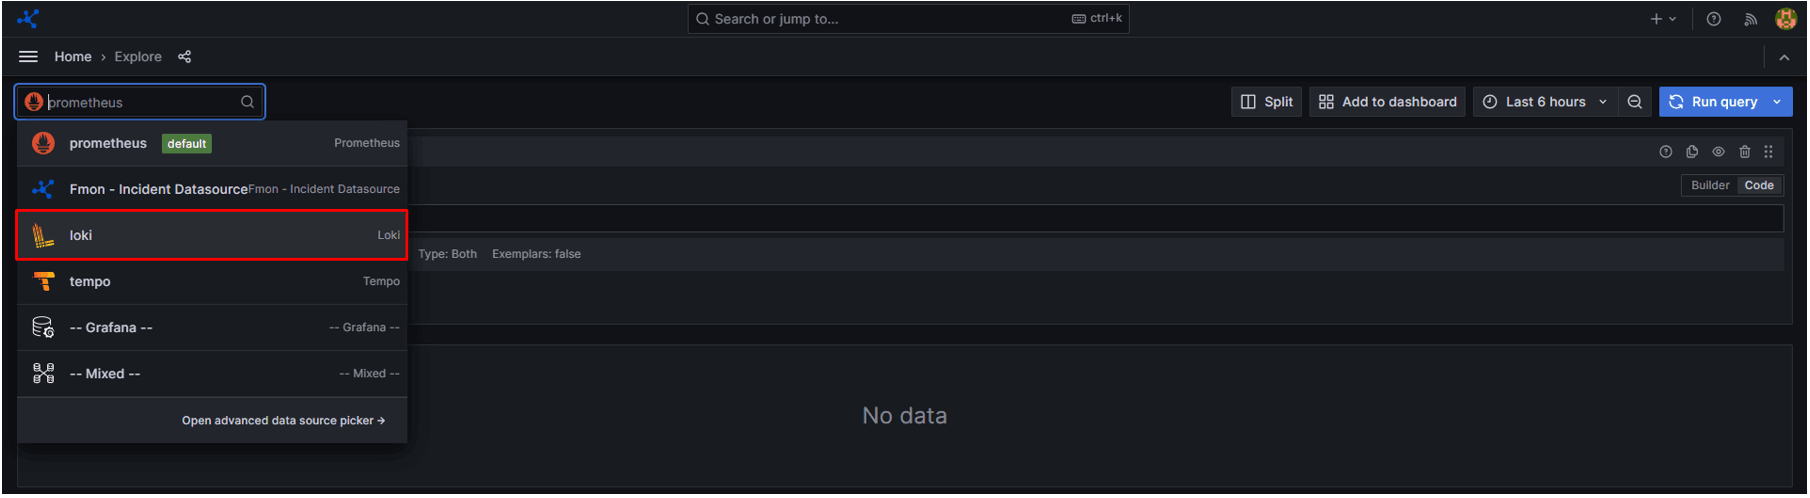
Select "Loki":
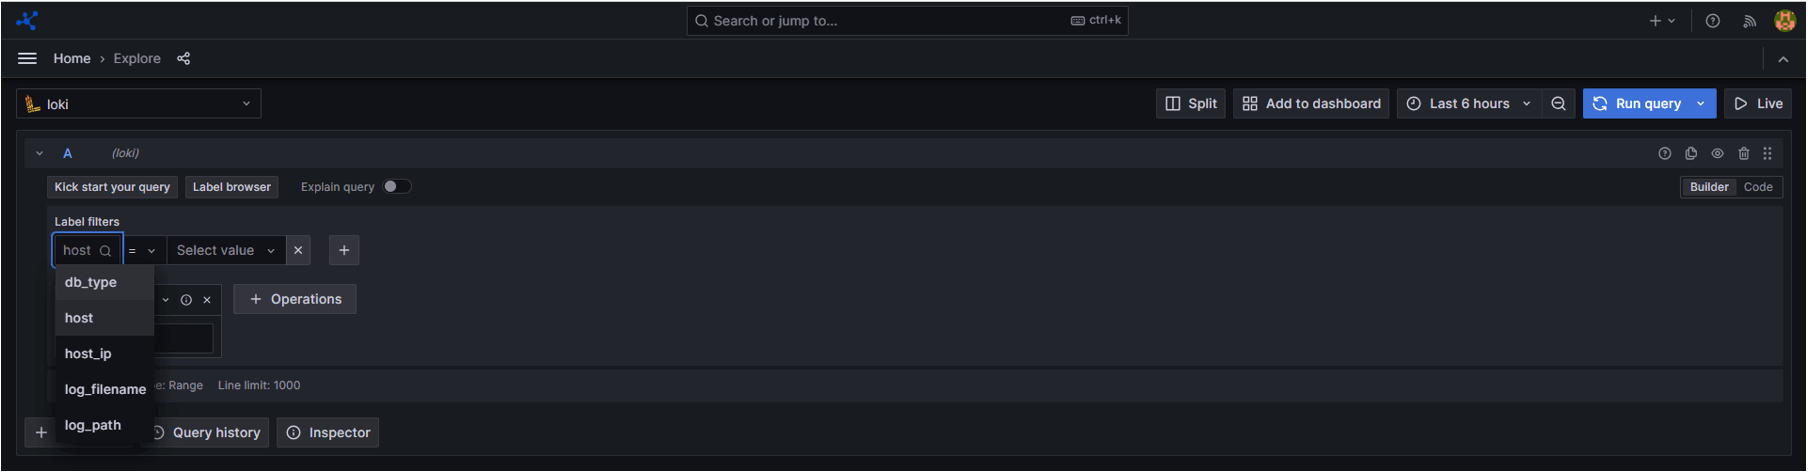
In the label filter field, select the label to view logs for:
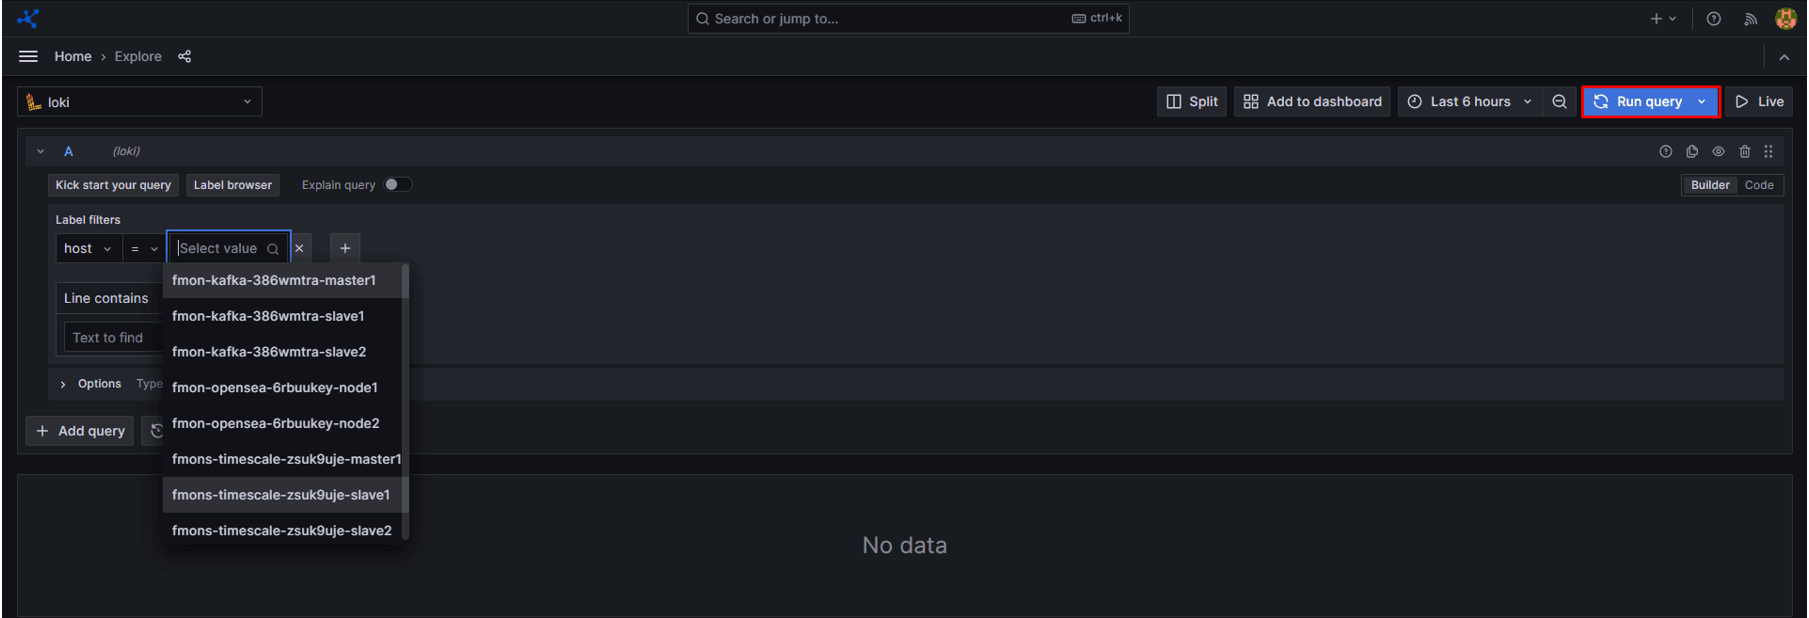
In the value field, select the object to view logs for:
Log information is displayed as follows: