Create a workspace
To access and use the Grafana Dashboard, you need to:
- Activate the Monitoring service.
- Successfully create a Workspace.
If you need assistance or encounter difficulties during setup, please contact the support team.
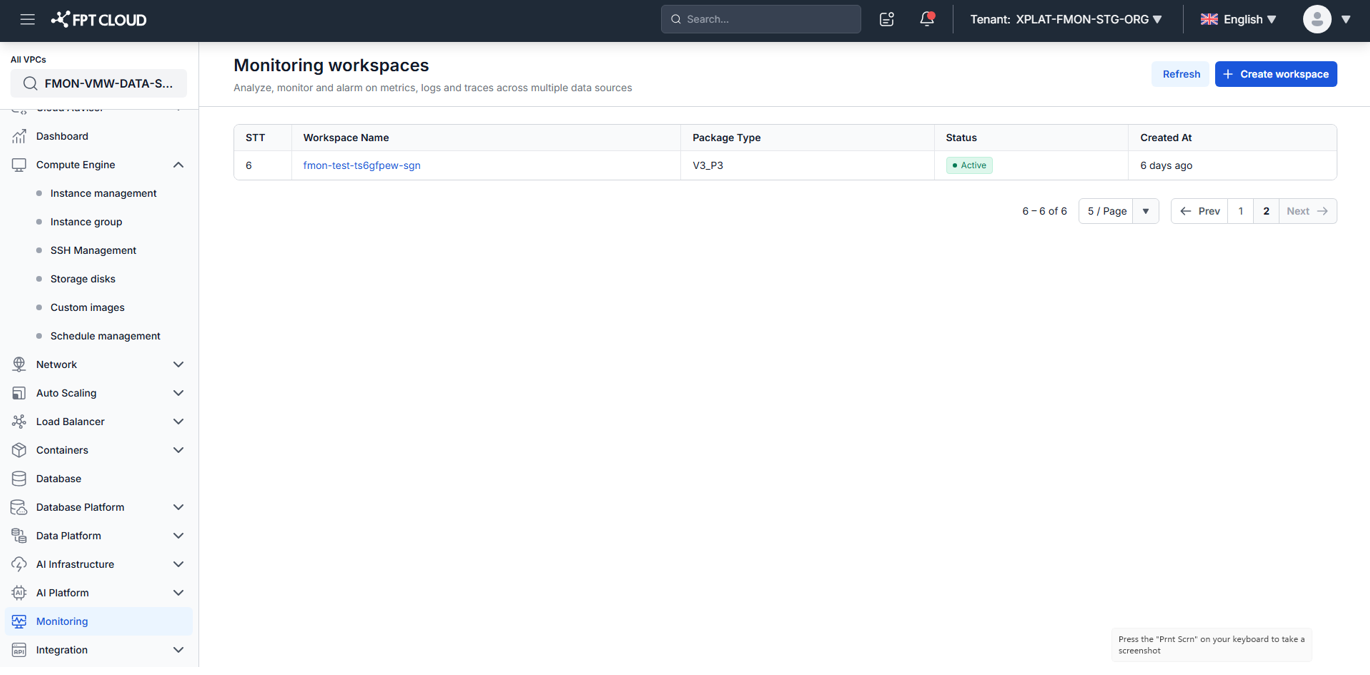
Example workspace interface after successful creation: