Create an alert rule
The following is a basic guide to creating an alert rule. For more detail, refer to the official Grafana documentation here.
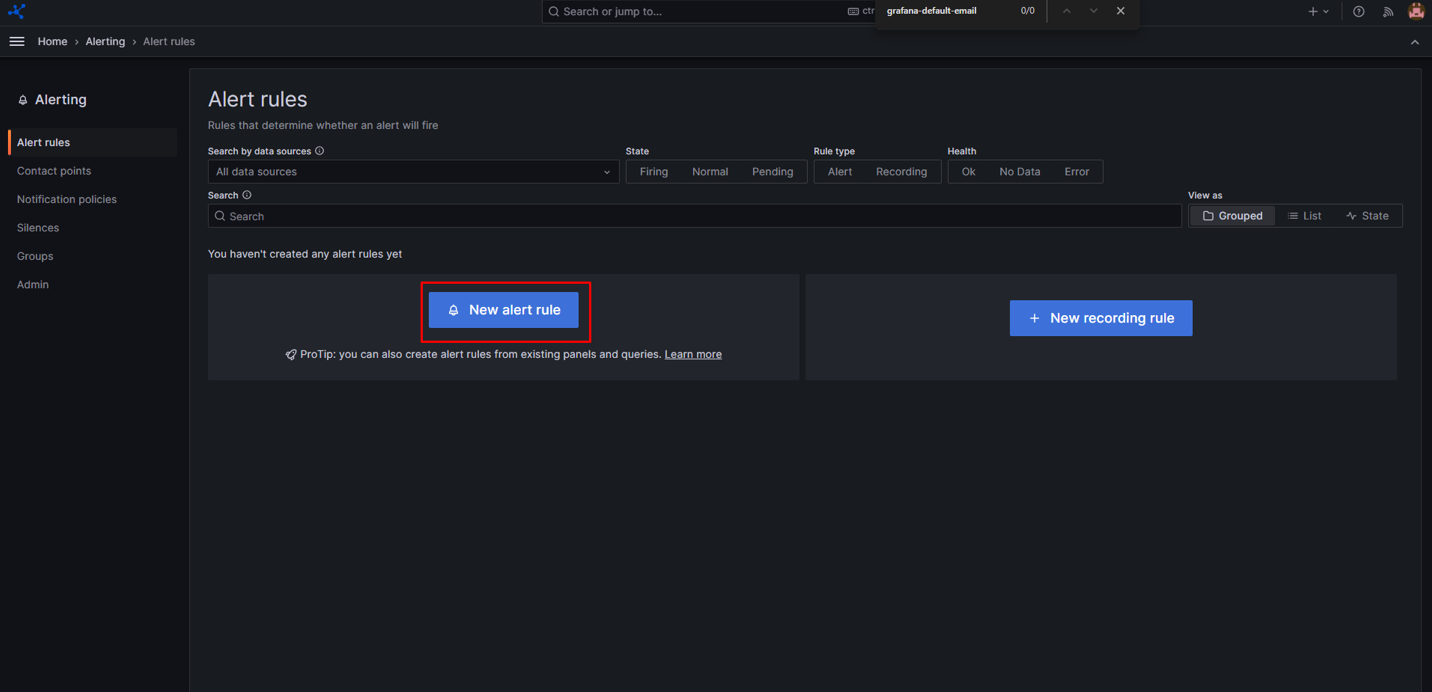
Step 1: Access Alerting
- Open Grafana.
- In the left menu > Alerting > Alert rules.
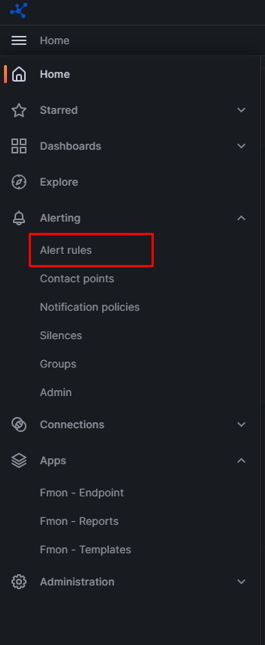
- Click New alert rule and enter the alert rule name.
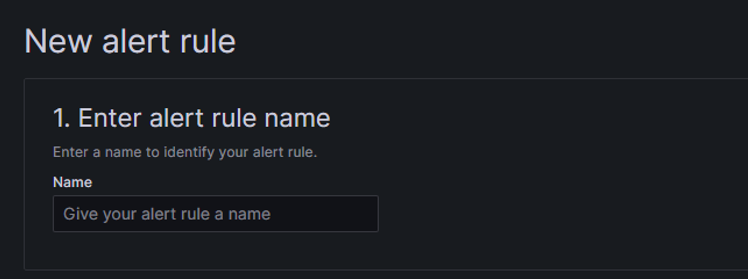
The name is:
- Displayed in the alert rule list.
- Used as the value of the
alertnamelabel for all alert instances generated by this rule.
Step 2: Define the query and condition
Define the query to fetch the data to monitor and the condition that must be met before the alert rule fires.
- Select a data source (for example: Prometheus).
- Enter the metric query. This query is the input for the alert condition.
Example: cpu_usage_percent > 80
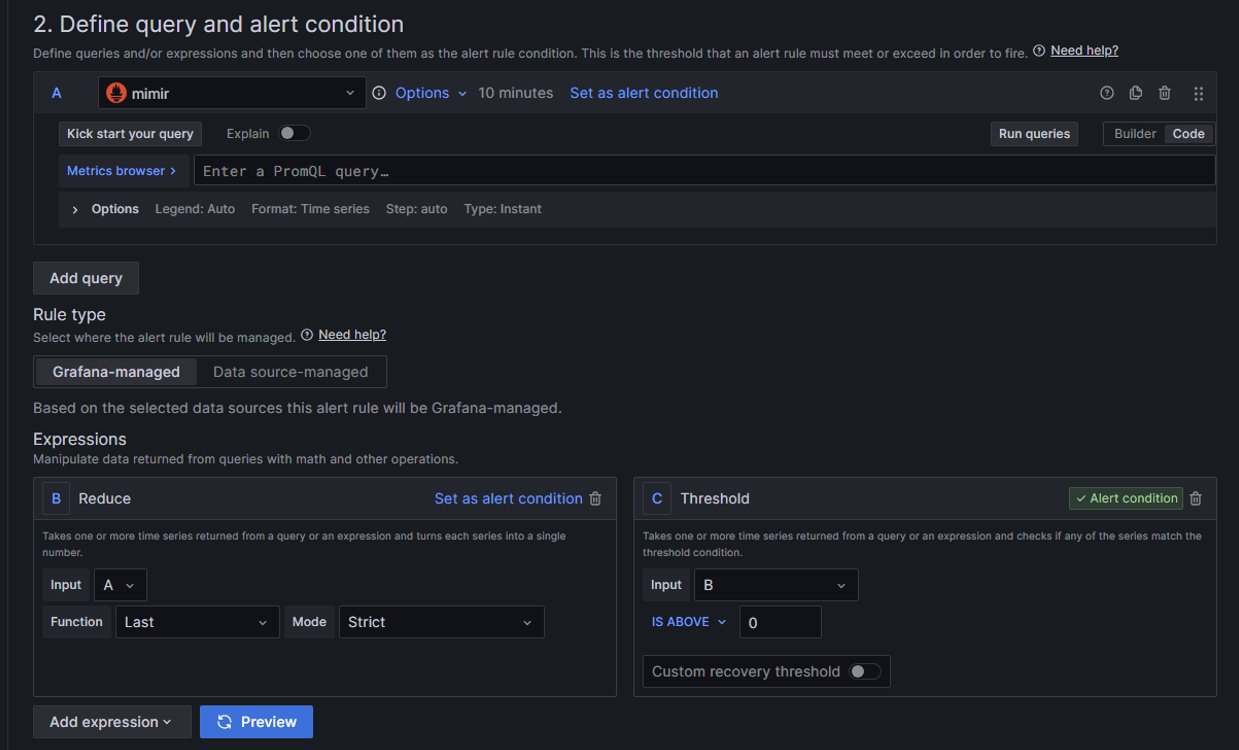
Then define the condition.
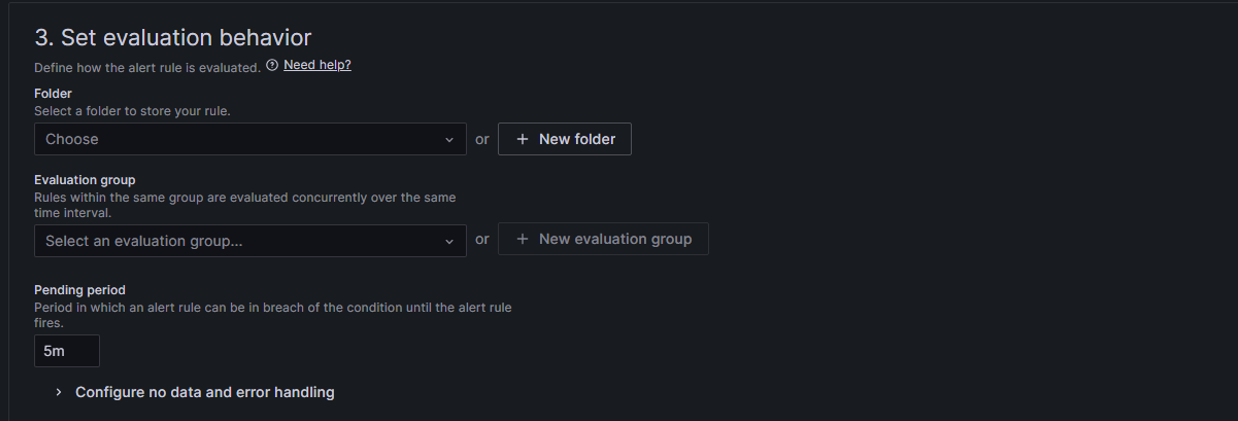
Step 3: Configure alert evaluation behavior
Set the evaluation frequency and how the alert transitions between states.
- Select a folder or click + New folder to choose where to save the alert rule.
- Select an evaluation group or create a new one. Rules in the same group are evaluated simultaneously on the same interval.
- If creating a new group, specify the interval.
- Enter the pending period: the time the alert must violate the condition before firing.
Step 4: Add annotations
Use annotations to provide additional context in the alert message.
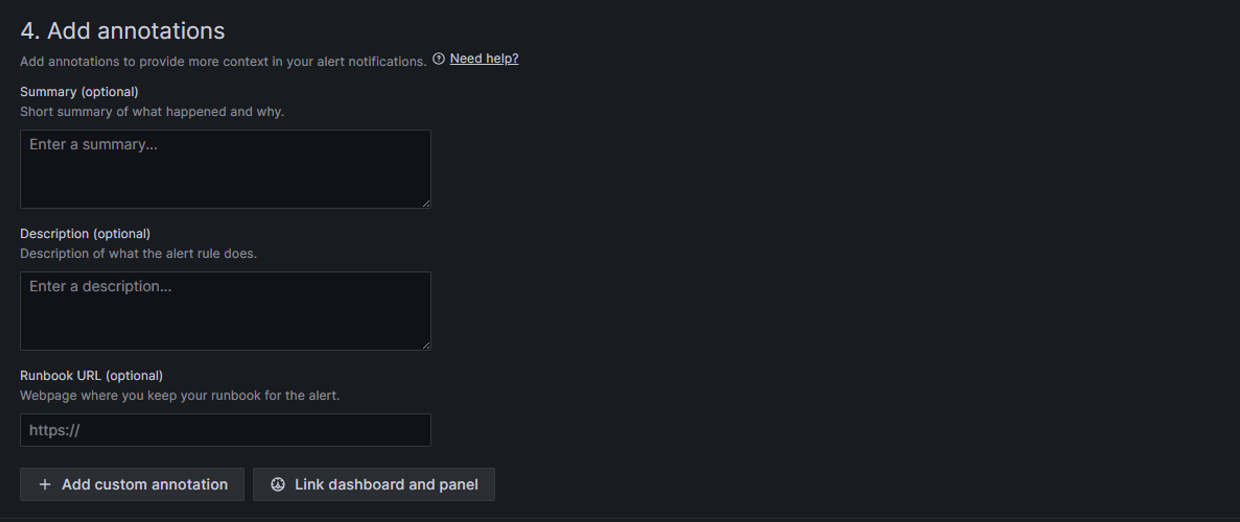
Optional annotation fields:
- Summary: Brief description of the incident.
- Description: Description of the alert rule.
- Runbook URL: Link to the handling runbook.
- Custom annotation: Additional information.
- Link dashboard & panel: Link to related dashboard or panel.
Example:
summary = High CPU usage
description = CPU usage is above 80% for more than 5 minutes
Step 5: Labels and notifications
Step 6: Save the alert rule
- Click Save in the top right corner.
The alert rule is created successfully.
To verify the alert after creation:
- Go to Alerting > Alert rules.
- Check the status: Normal / Pending / Firing.