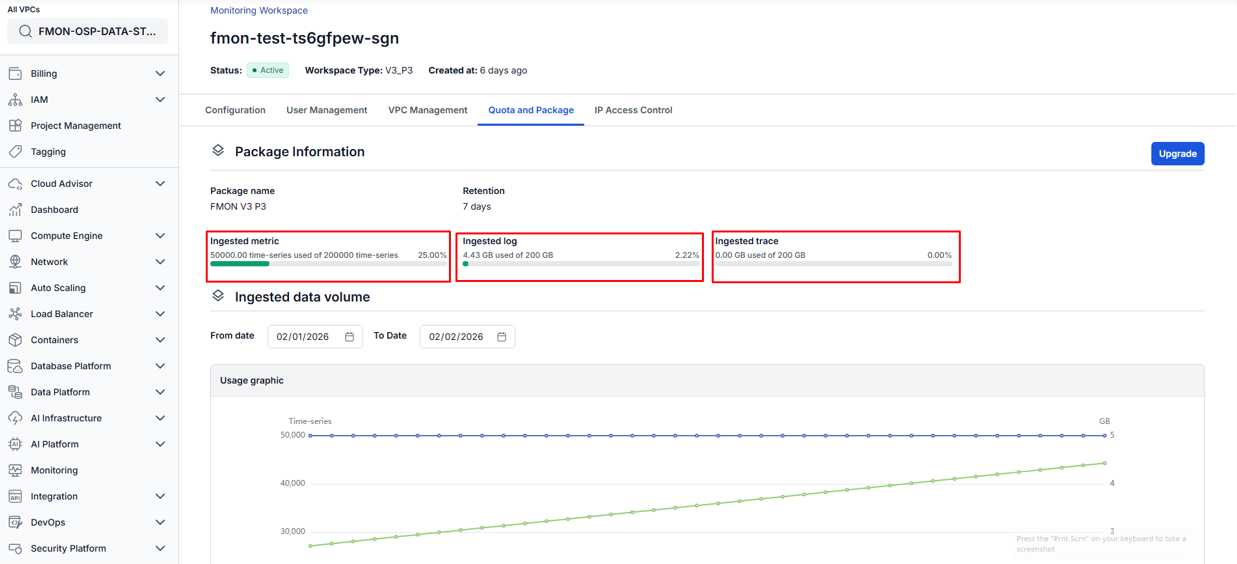
Check Grafana usage
To check how much of your timeseries, logs, and trace quota you have used:
Step 1: Go to the console portal and select the Monitoring service from the menu.
Step 2: Go to the workspace detail page and select the Quota and Package tab.
Step 3: Review the usage information for time series, logs, and traces.
-
Case 1: The workspace has used all quota allowed by the current package. In this case, metrics and logs can no longer be pushed to the Grafana Dashboard. You need to upgrade your service package to continue using Monitoring.
-
Case 2: The workspace has not exceeded its quota but metrics and logs are still not displaying on the dashboard. Please contact the support team for assistance.