Database integration guide
Step 1: Access the monitoring feature
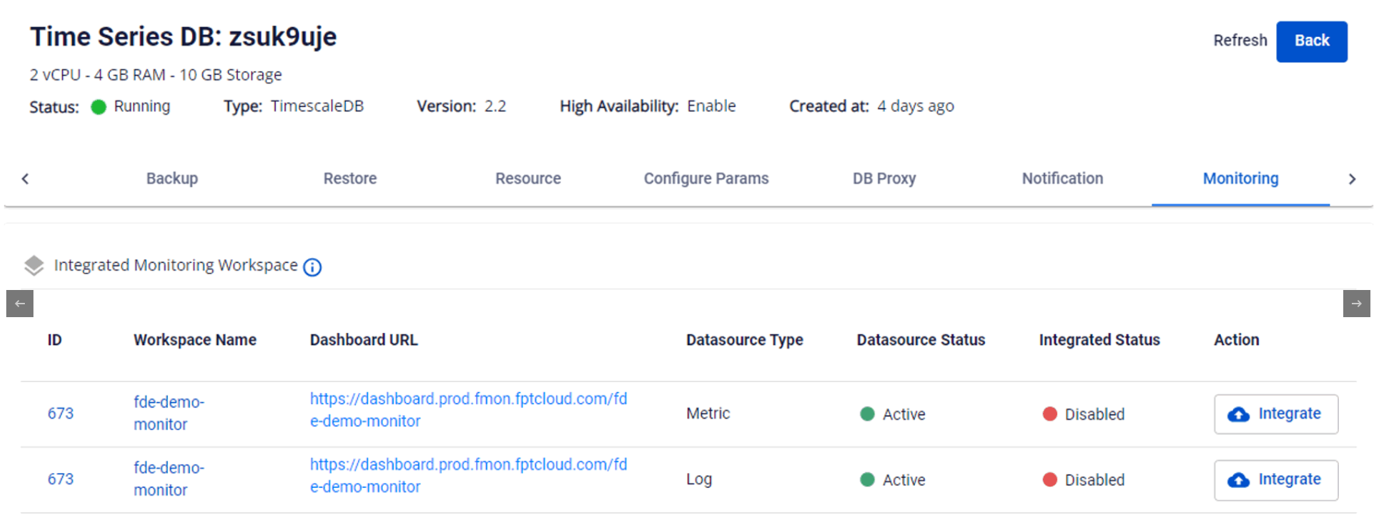
- After activating the Monitoring service and creating a workspace, go to the detail page of a database cluster on the Console Portal and select Monitoring.
- The system displays the list of metrics and logs by database type. Metrics or logs not yet integrated with FPT Monitoring will have Status = "Disabled".
Step 2: Integrate or disintegrate
Integrate
Enable metrics and logs collection for the cluster.
- On the Monitoring screen, select the Integrate action for the workspace to integrate.
- Confirm the action in the confirmation dialog to complete.
- After successful integration, the Integrated Status changes to Enabled and the FPT Monitoring system begins collecting the corresponding metrics.
Disintegrate
Disable metrics and logs collection for the database cluster.
- On the Monitoring screen, select the Disintegrate action for the workspace to stop monitoring.
- Confirm the action in the confirmation dialog to complete.
- After successful disintegration, the Integrated Status changes to Disabled and the FPT Monitoring system stops collecting metrics.
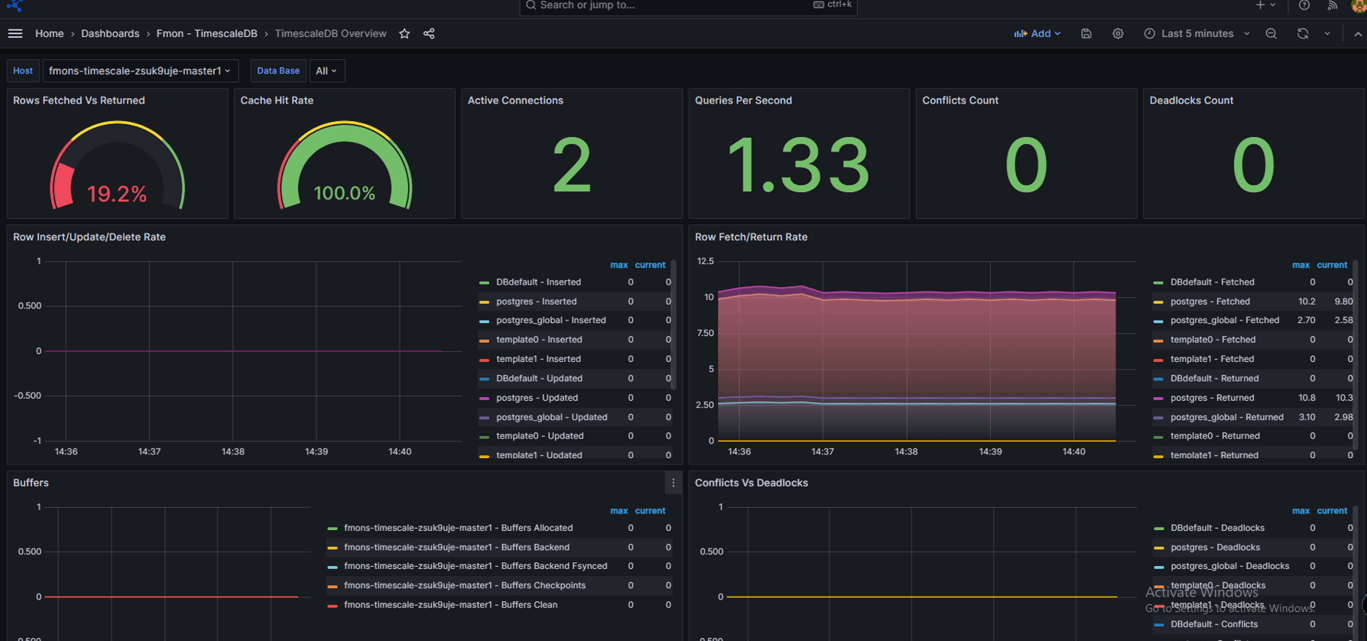
Step 3: Access the Grafana dashboard and view monitoring data
- After successful integration (Integrated Status = "Enabled"), click the Dashboard URL to go to Grafana.
- Then integrate the corresponding dashboard templates — see 3.1. Integrate dashboard template.
- Open the integrated dashboard to view monitoring information.