View metric data
You can monitor cluster performance, resource usage, and status metrics directly on the Grafana Dashboard.
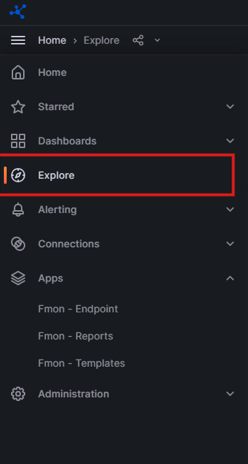
Step 1: On the menu, select Explore.
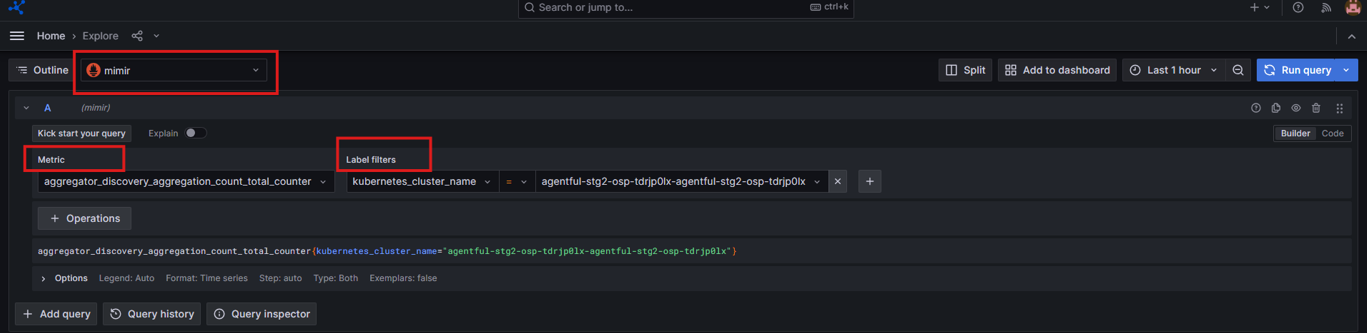
Step 2: Select the datasource: mimir.
- Select the metric type.
- Select the desired label filters.
- You can add more labels by clicking the icon
 .
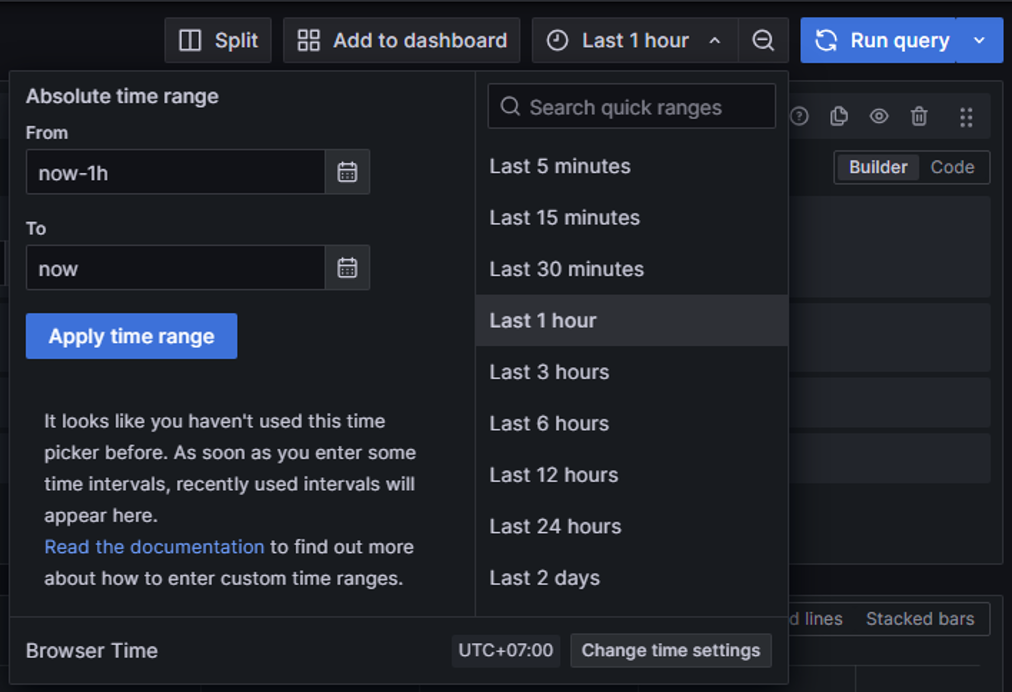
. - To view metrics over a specific time range, select a time filter.

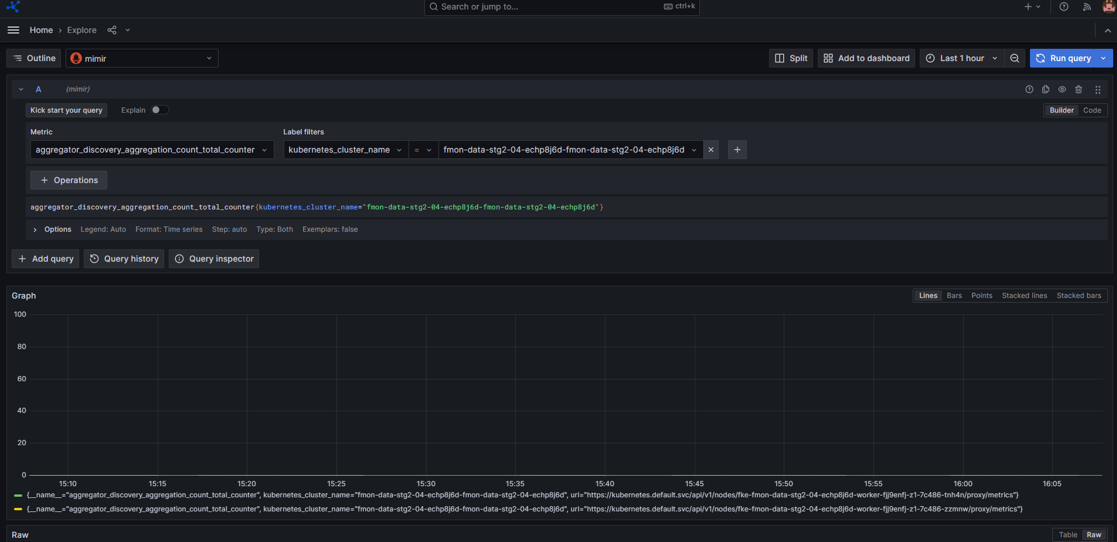
Step 3: Click Run query and the system returns the corresponding results.