Integrate dashboard template
You need to integrate the appropriate dashboard templates for each service to monitor your metrics.
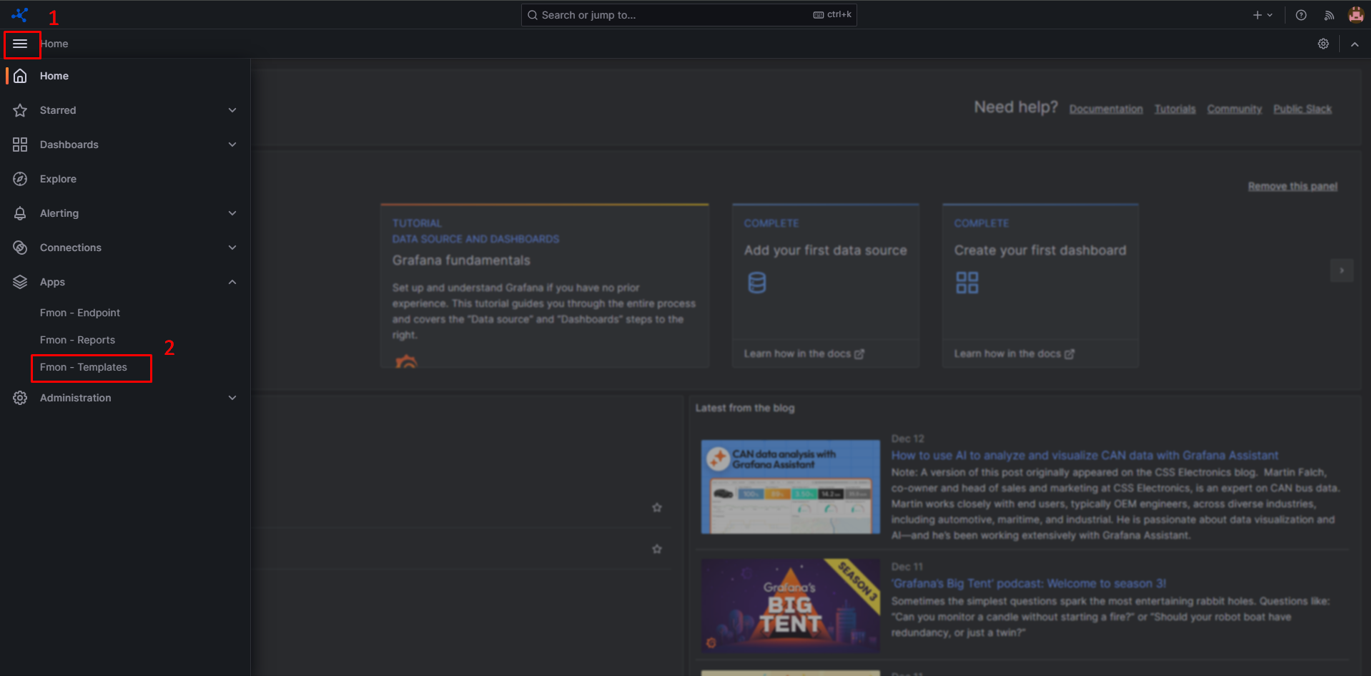
Step 1: Open the menu on the left side of the screen.
![]()
Step 2: Select App > Fmon – Templates > Dashboard Template tab.
The screen displays all available dashboard templates.
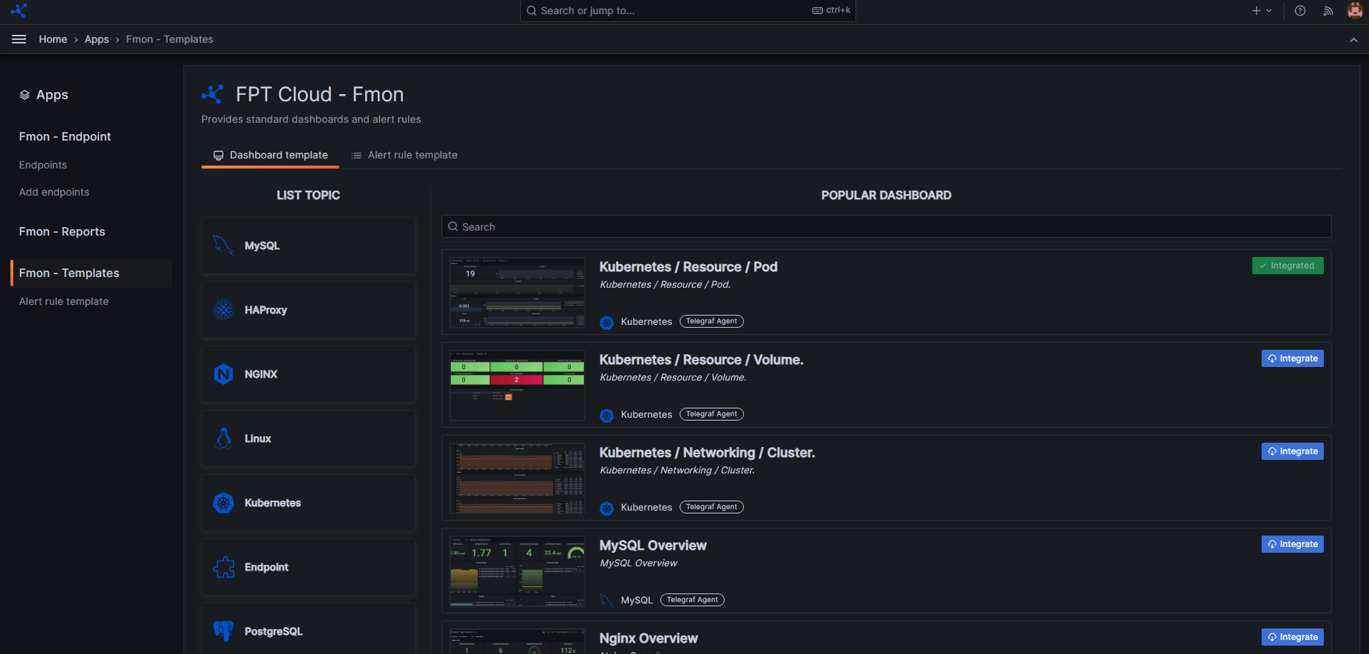
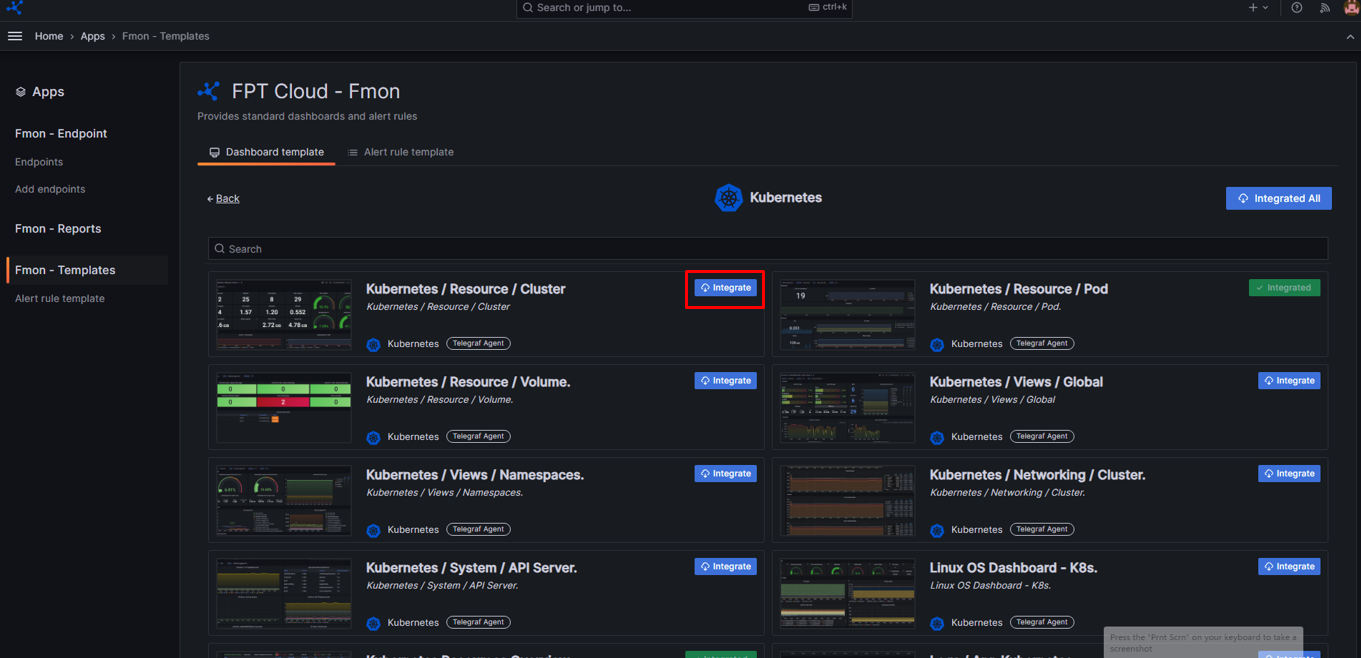
Step 3: Select the relevant Topic (for example: Kubernetes).
The system displays the dashboards available for the selected topic.
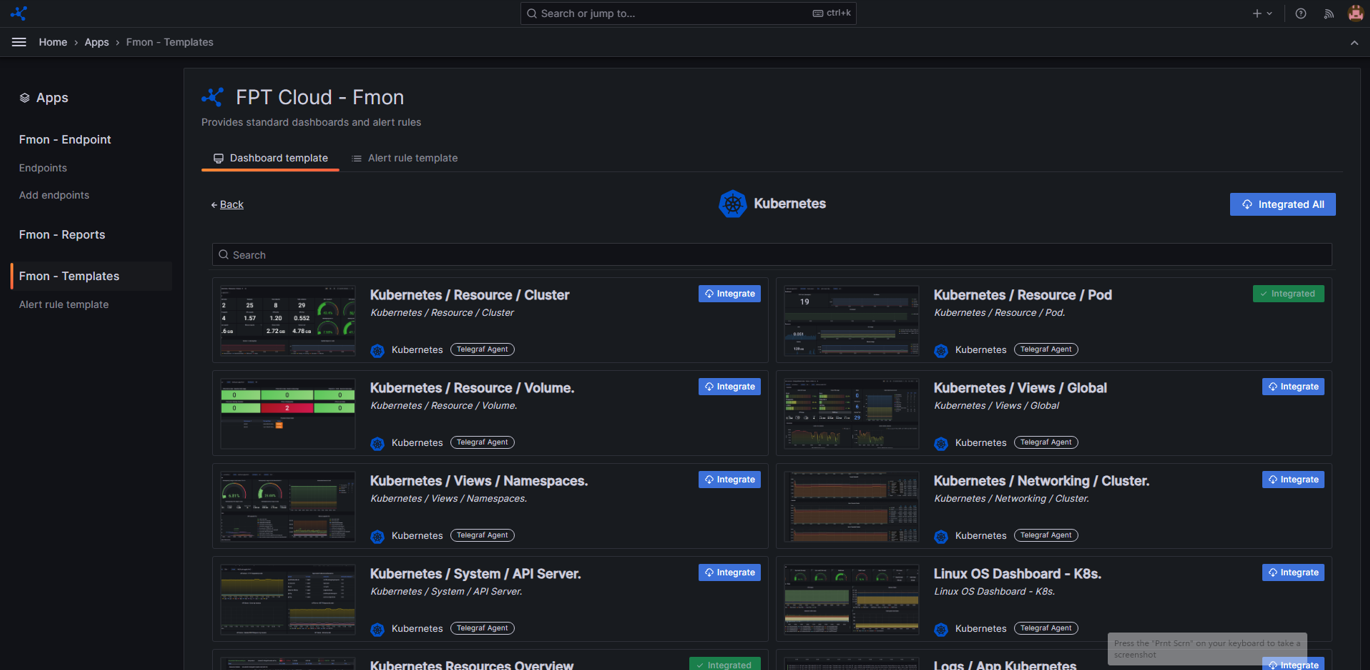
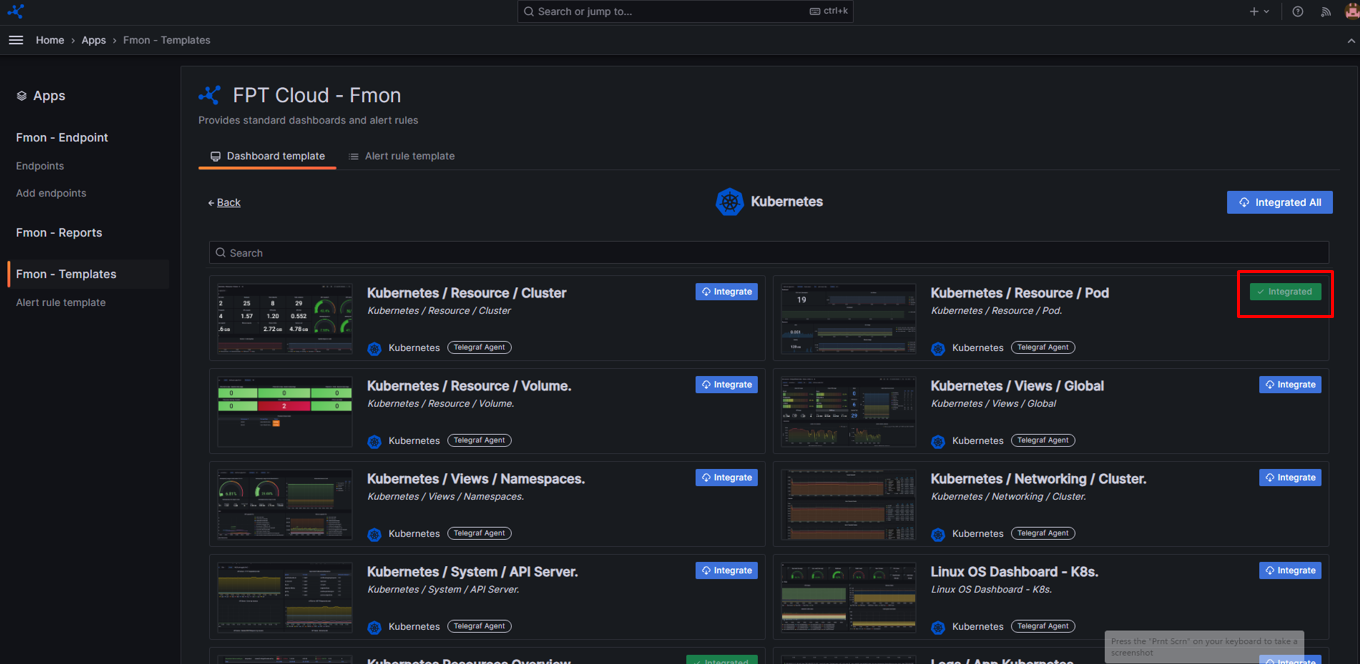
Step 4: Click Integrate to integrate the dashboard.
After successful integration, the dashboard status changes to Integrated.
If an error occurs during integration, please contact the support team.
The number of dashboards you can integrate depends on your current service package. For example, the V3_P1 package allows a maximum of 2 dashboards. If the limit is exceeded, the system displays a quota warning.
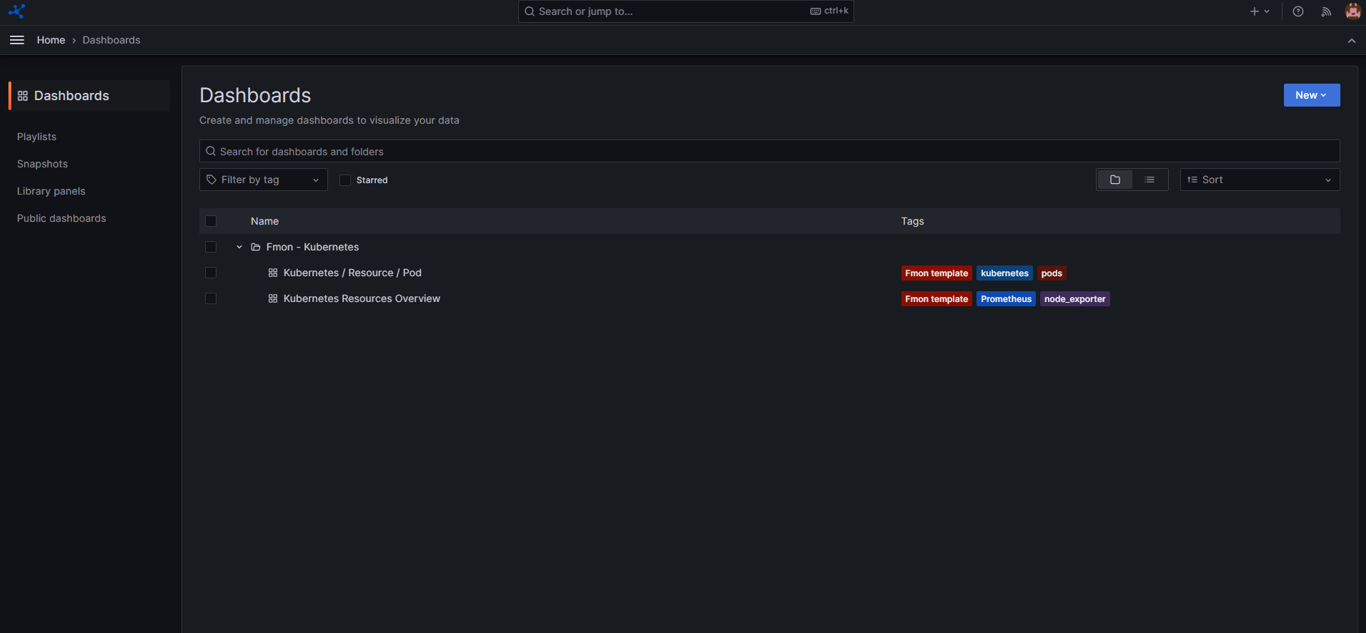
Step 5: After successful integration, refresh Grafana > open the menu > select Dashboards.
The system displays the integrated dashboards. You can open them to monitor the corresponding metrics.